Thursday, April 17, 2008
Replacement level: how many wins do injuries cost?
Replacement level can be a bit difficult to define in hockey. Unlike baseball, where Derek Jeter gets hurt and all his playing time goes to a guy who has yet to prove he can hit AAA pitching, an NHL player's minutes get spread around to other NHL players (aka his teammates) while he's hurt. So the Yankees can see the difference between Jeter and true replacement level, while an NHL team might shift every line and give nine low-leverage minutes to a guy who only dresses half the time, obscuring the difference between top players and the 21st guy on the roster.
I'm not going to try to compute replacement level here. Instead, I want to look at how many wins it costs a team when one of their top players is injured. For the last five seasons, I looked at forwards who averaged 19 minutes or more per game and defensemen who averaged 21 minutes or more - and who played between 52 and 74 games with a single team. This roughly corresponds to a team's top two forwards and top two defensemen. I compared their team's record with them in the lineup to its record with them out of the lineup. Here are the results:
The overall winning percentage when players were in the line-up was close to .500 for both datasets, which we would expect since playing time is evenly distributed across good and bad teams. And for both forwards and defensemen, there was a clear difference in winning percentage when these players were out of the lineup. However, the difference was much greater for defensemen overall, and in four out of five seasons for which we have ice time data. Teams can expect to lose four extra games if one of their top two blueliners goes down for the season, while losing a first-line forward appears to cost just one and a half losses. The error bars on these estimates are large, but it's clear that losing a defenseman is a bigger deal than losing a forward.
* - Winning percentage was calculated assuming SO and OT games were ties.
I'm not going to try to compute replacement level here. Instead, I want to look at how many wins it costs a team when one of their top players is injured. For the last five seasons, I looked at forwards who averaged 19 minutes or more per game and defensemen who averaged 21 minutes or more - and who played between 52 and 74 games with a single team. This roughly corresponds to a team's top two forwards and top two defensemen. I compared their team's record with them in the lineup to its record with them out of the lineup. Here are the results:
Forwards (~19 mins TOI or more)

        Games         Games         Pts
        Played Wpct*  Missed Wpct   Delta/82GP
Total   6540   0.502  1619   0.484  3.07
2007-08 1292   0.508   348   0.487  3.39
2006-07 1331   0.491   309   0.479  2.03
2005-06 1344   0.510   296   0.483  4.48
2003-04 1240   0.505   360   0.474  5.19
2002-03 1300   0.492   296   0.441  8.37

Defensemen (~21 mins TOI or more)

        Games         Games         Pts
        Played Wpct   Missed Wpct   Delta/82GP
Total   6610   0.498  1546   0.447  8.44
2007-08 1325   0.486   315   0.443  7.08
2006-07 1322   0.505   318   0.447  9.64
2005-06 1318   0.503   322   0.429  12.27
2003-04 1300   0.492   296   0.441  8.37
2002-03 1345   0.505   295   0.478  4.47
The overall winning percentage when players were in the line-up was close to .500 for both datasets, which we would expect since playing time is evenly distributed across good and bad teams. And for both forwards and defensemen, there was a clear difference in winning percentage when these players were out of the lineup. However, the difference was much greater for defensemen overall, and in four out of five seasons for which we have ice time data. Teams can expect to lose four extra games if one of their top two blueliners goes down for the season, while losing a first-line forward appears to cost just one and a half losses. The error bars on these estimates are large, but it's clear that losing a defenseman is a bigger deal than losing a forward.
* - Winning percentage was calculated assuming SO and OT games were ties.
Labels: Replacement Level
Wednesday, April 16, 2008
How does an NHL coach's age affect his performance?
Thanks to hockey-reference.com's new and better-organized data, I was able to hammer out a project I've been thinking about for months in about half an hour yesterday. I read a baseball article about managerial aging patterns and I wanted to see what role a coach's age played in the NHL.
What I did was as follows: at each age, I totaled the number of points a coach's team got in the standings and compared that to the number of points we would have expected based on their goals for and against. The idea is that coaches reach some peak performance level where they can get their teams to produce better results than what their raw goal differential would suggest. No one has ever coached an NHL team at age 25 or age 70, so clearly there is skills growth and decline among the coaching population.
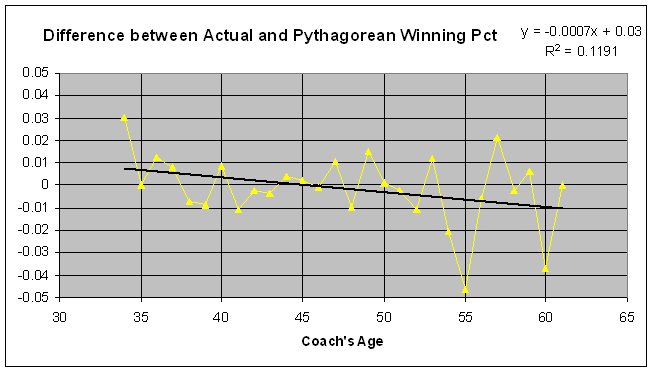
The dataset starts in 1967 and ends in 2004 (because goal totals post-lockout include phantom SO winners.) This chart shows that delta on a per game basis:
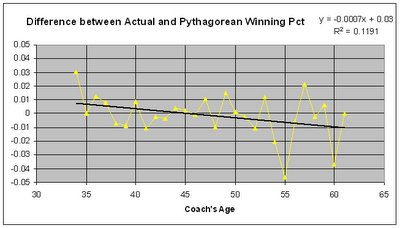
One thing that's obvious is that once coaches reach their mid-fifties they can potentially fall off a cliff. Beyond age 61, coaching is really the exclusive province of Scotty Bowman and Roger Neilson. But for the bulk of their careers - age 35 to 53, which accounts for 86% of all games coached - there is, to my eye, and my spreadsheet, no discernible trend. The only thing I see is that coaches aged 54-61 accounted for 10% of games coached despite the variation in their performance, which suggests that legendary coaches are allowed to stay on until they run their teams into the ground, rather than being asked to retire at the beginning of their decline phase.
What I did was as follows: at each age, I totaled the number of points a coach's team got in the standings and compared that to the number of points we would have expected based on their goals for and against. The idea is that coaches reach some peak performance level where they can get their teams to produce better results than what their raw goal differential would suggest. No one has ever coached an NHL team at age 25 or age 70, so clearly there is skills growth and decline among the coaching population.
The dataset starts in 1967 and ends in 2004 (because goal totals post-lockout include phantom SO winners.) This chart shows that delta on a per game basis:
One thing that's obvious is that once coaches reach their mid-fifties they can potentially fall off a cliff. Beyond age 61, coaching is really the exclusive province of Scotty Bowman and Roger Neilson. But for the bulk of their careers - age 35 to 53, which accounts for 86% of all games coached - there is, to my eye, and my spreadsheet, no discernible trend. The only thing I see is that coaches aged 54-61 accounted for 10% of games coached despite the variation in their performance, which suggests that legendary coaches are allowed to stay on until they run their teams into the ground, rather than being asked to retire at the beginning of their decline phase.
Labels: Aging, Coaching, Hockey-reference
Tuesday, April 15, 2008
Hockey-reference.com: The best historical NHL stats site on the internet
If you're even remotely like me, you've pored over hockeydb.com many times, reconstructing the careers of players you remember from your childhood. The numbers don't often match the memories...I wore #17 growing up because it was Jim Nill's number - anybody want to tell me why that makes sense?
Anyways, I've spent many days pulling data off hockeydb to run the statistical analyses I have on my site. But now hockey-reference has come in with way more and better stats, plus they'll let you grab portions of the database for all your exciting Excel spreadsheet work. Take a look, and I think you'll agree that Hockey-reference is the best NHL stats site out there today.
http://www.hockey-reference.com
Labels: Hockey-reference
![]()
Subscribe to Posts [Atom]
