Wednesday, April 29, 2009
Shooting Percentage by Location of Directed Shot
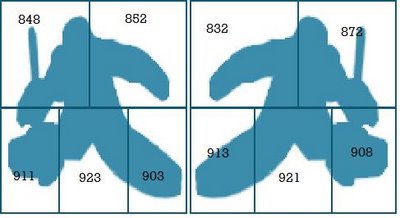
Here's the save percentage by right- and left-handed goalies during the 2008-09 season:

I'll admit that I'm not completely sure what's interesting about this data - I have it for every goaltender and every shooter - so if you've got a good idea, send it my way.
Update: Hockey Numbers was all over this back in 2007. The 2006-07 data is no longer available, oddly enough.

I'll admit that I'm not completely sure what's interesting about this data - I have it for every goaltender and every shooter - so if you've got a good idea, send it my way.
Update: Hockey Numbers was all over this back in 2007. The 2006-07 data is no longer available, oddly enough.
Labels: Goaltending
Friday, April 24, 2009
2008-09 5v5 Goaltender Performance
Last year, I posted my methodology for calculating the quality of shots faced by a goaltender, along with the results of this analysis.
The 2008-09 results are below (minimum 700 minutes played at 5v5). The last column, DELTAGAA, shows how much lower a goaltender's Goals-Against-Average was than we would expect it to be given the shots he faced. Henrik Lundqvist, Tim Thomas and Jonas Hiller are the only goaltenders who appear in the Top 10 both this year and last year.
At any rate, here are the top 10:
Full stats for this season and last available at: http://www.behindthenet.ca/2008/5_on_5_goalie_shot_quality.php?sort=10
The 2008-09 results are below (minimum 700 minutes played at 5v5). The last column, DELTAGAA, shows how much lower a goaltender's Goals-Against-Average was than we would expect it to be given the shots he faced. Henrik Lundqvist, Tim Thomas and Jonas Hiller are the only goaltenders who appear in the Top 10 both this year and last year.
At any rate, here are the top 10:
NAME                GP   SPCT   GAA    ExSPT  ExGAA   DELTAGAA
TIM THOMAS          54   937    1.87   911    2.64     -0.77
NIKOLAI KHABIBULIN  42   927    1.94   902    2.64     -0.70
ROBERTO LUONGO      54   931    1.90   906    2.59     -0.69
HENRIK LUNDQVIST    69   913    2.38   890    3.00     -0.63
TOMAS VOKOUN        59   931    2.25   913    2.84     -0.59
KARI LEHTONEN       46   917    2.73   900    3.29     -0.56
JONAS HILLER        46   927    1.90   906    2.46     -0.56
MARTIN BRODEUR      31   930    1.90   912    2.38     -0.49
CRAIG ANDERSON      31   922    2.62   909    3.09     -0.47
MANNY FERNANDEZ     28   921    2.18   905    2.64     -0.45
Full stats for this season and last available at: http://www.behindthenet.ca/2008/5_on_5_goalie_shot_quality.php?sort=10
Labels: Goaltending, Shooting
Thursday, April 23, 2009
Swallowing the Whistle?
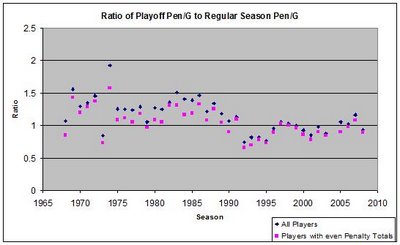
Since the early 1990s, many fewer penalties have been called in playoff games than during the regular season, with the ratio dropping as low as 74%. But for the vast majority of seasons before 1990, many more penalties were called in the playoffs:

The reason, of course, is fighting - lots and lots of bench-clearing brawls. Once they were eliminated, the total penalty count dropped significantly. But that doesn't tell us if hooking and tripping and interference penalties have gone down - the second curve on the plot shows the penalty ratio only for players who had even penalty totals (mostly players who had zero fights...but obviously also two, four, six or more). The ratio drops for such players, but it still doesn't answer the question. We'd need to find minor penalty totals to figure this out...

The reason, of course, is fighting - lots and lots of bench-clearing brawls. Once they were eliminated, the total penalty count dropped significantly. But that doesn't tell us if hooking and tripping and interference penalties have gone down - the second curve on the plot shows the penalty ratio only for players who had even penalty totals (mostly players who had zero fights...but obviously also two, four, six or more). The ratio drops for such players, but it still doesn't answer the question. We'd need to find minor penalty totals to figure this out...
Labels: playoffs
Playoff Performance by Age
There's no question that scoring rates drop during the playoffs, but James Mirtle wonders if it's fair to count "every game as being equal, whether those postseason games were played as an 18-year-old rookie, 27-year-old sniper or a 37-year-old greybeard..."
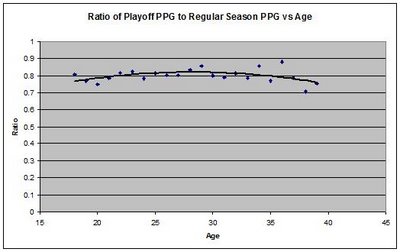
At first glance, it seems like a reasonable thing to do. The ratio between playoff and regular season scoring is shown below for ages 18-40:

And it's incredibly rare to play in the playoffs at either an old or young age - 94% of players in the playoffs are between 20 and 34 on January 1st of a given season. A linear fit indicates no relationship between age and scoring ratio, while a polynomial fit indicates a slight difference. Counting all games as equal seems like the right thing to do.
At first glance, it seems like a reasonable thing to do. The ratio between playoff and regular season scoring is shown below for ages 18-40:

And it's incredibly rare to play in the playoffs at either an old or young age - 94% of players in the playoffs are between 20 and 34 on January 1st of a given season. A linear fit indicates no relationship between age and scoring ratio, while a polynomial fit indicates a slight difference. Counting all games as equal seems like the right thing to do.
Tuesday, April 14, 2009
New Puck Prospectus Article: Stanley Cup Scenarios
The key to predicting the performance of hockey teams is figuring out their "true talent," which is easier said than done. In baseball, numerous people make reasonable projections of playing time for each player on every team, along with predicting offensive and defensive contributions. With these projections, an expected level of performance for each team can be estimated. We're not there in hockey - all we have to go on is a team's actual performance; in particular, its expected winning percentage based on goals scored and allowed during regulation play. We can make adjustments to this winning percentage if the team faced a tough schedule or if it made significant trade deadline acquisitions or had star players returning from or lost to injuries. However, for the vast majority of teams - including the field this season - estimated "true talent" and actual performance are within a few percentage points of each other...
http://www.puckprospectus.com/article.php?articleid=77
http://www.puckprospectus.com/article.php?articleid=77
Saturday, April 11, 2009
New Post on Puck Prospectus: The Plus and Minus of Plus/Minus
"Hockey is usually not the sport where statistical or analytical innovation takes place. So it's ironic that one of the most useful concepts in sports statistics has been an official NHL statistic for over 40 seasons, leading other sports by at least three decades. The statistic in question is Plus/Minus, which is perhaps the biggest subject of debate in hockey right now. Even though it accounts for the two most important actions in hockey, scoring goals and preventing goals, nobody can agree on what's wrong with it or how to fix it."
http://www.puckprospectus.com/article.php?articleid=70
http://www.puckprospectus.com/article.php?articleid=70
Playoff Offensive Levels 1968-2008

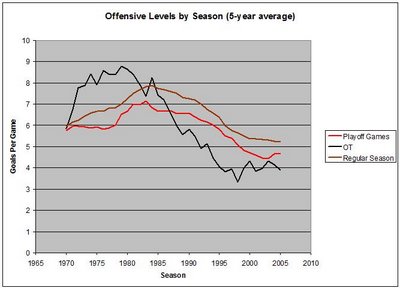
One unsurprising result here: there are fewer goals scored in the playoffs than during the regular season. If you're down by three in the second during the regular season, you'll probably rest your best players to keep them from getting hurt in a meaningless game. In the playoffs, there's no point, and no giving up.
But the OT scoring levels are surprising: throughout the 1970s and early 1980s, teams apparently played more offensively in overtime than they did during regulation. But the opposite has now been true for more than 20 years.
Monday, April 6, 2009
New Post on Puck Prospectus: Hockey's Different Games
"Let's start with a simple hypothetical. Imagine you have never been to a hockey game before. The referee drops the puck and five on five play begins with both teams forechecking, playing defense and passing the puck with a few shots per minute on each netminder. Suddenly a penalty is drawn, completely changing the dynamics of the game..."
http://www.puckprospectus.com/article.php?articleid=63
http://www.puckprospectus.com/article.php?articleid=63
Labels: Puck Prospectus
Subscribe to Posts [Atom]
