Saturday, December 29, 2007
What happens when you pull your goalie?
Someone asked me the other day what teams expect to happen when they pull their goalies at the end of the game. My answer, qualitatively, was that it increases the likelihood of a goal - either for or against - and because a loss is the same whether by one goal or two goals, pulling your goalie gets you extra goals and extra ties and wins.
But what about the quantitative outcome? This chart shows the 5v5 goal-scoring rate this season in the last six minutes of games where the goalie was pulled by one team.
The scoring rate without the goalie pulled is somewhat lower than the overall rate in all games, which we expect because these are close games (ie - you wouldn't pull the goalie if you were down 5 goals). But when teams pull their goalie, the outcome is usually negative: the opposing team is almost 10 times as likely to put the game away with an empty-net goal, but again, a loss is a loss whether it's by one goal or two.
On the positive side, teams score 5.5 goals per 60 minutes when they pull their goalies, which makes them almost four times as likely to score the tying goal than if they'd kept the goalie in. Overall, 40-60 games per year get tied up with the goalie pulled, compared to less than 10 if goalies stayed in. This represents a average gain of 2-2.5 points in the standings per team, clearly justifying the strategy.
But what about the quantitative outcome? This chart shows the 5v5 goal-scoring rate this season in the last six minutes of games where the goalie was pulled by one team.
| G/60 | GF/60 | GA/60 | |
| Goalie Pulled | 20.0 | 5.5 | 14.6 |
| No Goalie Pulled | 3.05 |
The scoring rate without the goalie pulled is somewhat lower than the overall rate in all games, which we expect because these are close games (ie - you wouldn't pull the goalie if you were down 5 goals). But when teams pull their goalie, the outcome is usually negative: the opposing team is almost 10 times as likely to put the game away with an empty-net goal, but again, a loss is a loss whether it's by one goal or two.
On the positive side, teams score 5.5 goals per 60 minutes when they pull their goalies, which makes them almost four times as likely to score the tying goal than if they'd kept the goalie in. Overall, 40-60 games per year get tied up with the goalie pulled, compared to less than 10 if goalies stayed in. This represents a average gain of 2-2.5 points in the standings per team, clearly justifying the strategy.
Labels: Pulling the Goalie
Friday, December 28, 2007
Zetterberg vs Lecavalier defensively
There was a particularly insightful post over at Irreverent Oiler Fans comparing Henrik Zetterberg to Vincent Lecavalier. The gist of it is that their offensive stats may be comparable, but when you look at both +/- and shots directed at the net, Lecavalier is very weak defensively compared to Zetterberg.
If I run the 5v5 shot analysis from below on these two, I get something like this:
EXP GA is the expected number of goals allowed by each player, assuming a league average goaltender. EXP SPCT is the expected save percentage under those same conditions.
Two things come out of this data:
1) Lecavalier gives up a lot more shots on goal when he's on the ice than Zetterberg.
2) The shots Lecavalier gives up aren't better shots, but Tampa's goaltending is a lot worse than average, so it looks like opponents score a lot more when he's on the ice.
I think this is the best way to visualize the situation:
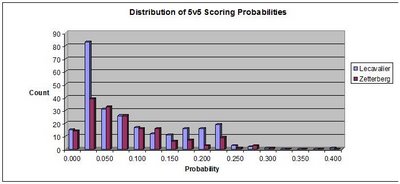
Lecavalier leads Zetterberg in two major categories of shots allowed: very high percentage shots (20% chance of scoring, usually within 10 feet of the goal) and low percentage shots (2.5% chance of scoring). Those two cases cancel each other out, so overall, the average opponent shot when Lecavalier is on the ice isn't any tougher for the goalie to handle. This shows up in the minimal difference in expected save percentage.
But that doesn't change the fact that Lecavalier simply allows a lot more shots when he's on the ice, and even if they're not tough to handle, he's going to allow a lot more goals than Zetterberg.
If I run the 5v5 shot analysis from below on these two, I get something like this:
| Player | GA | SA | SPCT | EXP GA | EXP SPCT |
| Lecavalier | 31 | 229 | 865 | 22.55 | 902 |
| Zetterberg | 16 | 164 | 902 | 14.37 | 912 |
EXP GA is the expected number of goals allowed by each player, assuming a league average goaltender. EXP SPCT is the expected save percentage under those same conditions.
Two things come out of this data:
1) Lecavalier gives up a lot more shots on goal when he's on the ice than Zetterberg.
2) The shots Lecavalier gives up aren't better shots, but Tampa's goaltending is a lot worse than average, so it looks like opponents score a lot more when he's on the ice.
I think this is the best way to visualize the situation:
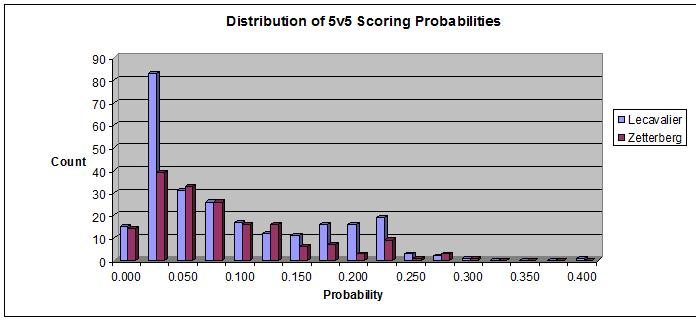
Lecavalier leads Zetterberg in two major categories of shots allowed: very high percentage shots (20% chance of scoring, usually within 10 feet of the goal) and low percentage shots (2.5% chance of scoring). Those two cases cancel each other out, so overall, the average opponent shot when Lecavalier is on the ice isn't any tougher for the goalie to handle. This shows up in the minimal difference in expected save percentage.
But that doesn't change the fact that Lecavalier simply allows a lot more shots when he's on the ice, and even if they're not tough to handle, he's going to allow a lot more goals than Zetterberg.
Labels: Shooting
Wednesday, December 26, 2007
The Economic Prospects of a Hockey Player
I grew up in Winnipeg, surrounded by a lot of very good hockey players. When we were 12 or 13 years old, it was a foregone conclusion that some of them would get drafted and end up in the NHL. After all, there were a few solid local players in the pros: Mike Keane, Mike Ridley, Grant Ledyard and James Patrick.
But we should have noticed that of those four players, only Patrick was drafted. For the others, the road to the NHL was anything but direct: Ledyard played Tier II Junior, then spent almost three years in the minors; Keane played out his junior eligibility then spent a year in the minors; and Ridley, after losing a season after having his leg broken by Patrick in midget hockey, played Canadian college hockey.
Looking at players born 1973-1982 in Winnipeg, just 14 reached the NHL, with the longest career belonging to Tyler Arnason. Overall, just 7.3 players per year reached some significant level of professional hockey, which includes the NHL, AHL/IHL, minor pro leagues such as the ECHL, CHL or UHL, or top-division European leagues. If we assume an average wage of $10000 per game in the NHL, $1000 in the AHL, $500 in Europe and $200 in North American minor pro leagues, we get the following average salaries by age:
The average is of course skewed by players who manage to stay on an NHL roster throughout the entire year. The median salary at ages 23-25 is closer to $20000, since the majority of players play in minor pro leagues. I've introduced a survivor bias here too - barely 5% of AAA Bantam (age 15) players will make the jump to being regular players in Junior or the NCAA and get the opportunity to play professional hockey. Overall, fewer than 1% of top 15-year-olds will ever make the NHL minimum salary of $450000 in a season, and perhaps 3% will make the AHL average of $50000.
But we should have noticed that of those four players, only Patrick was drafted. For the others, the road to the NHL was anything but direct: Ledyard played Tier II Junior, then spent almost three years in the minors; Keane played out his junior eligibility then spent a year in the minors; and Ridley, after losing a season after having his leg broken by Patrick in midget hockey, played Canadian college hockey.
Looking at players born 1973-1982 in Winnipeg, just 14 reached the NHL, with the longest career belonging to Tyler Arnason. Overall, just 7.3 players per year reached some significant level of professional hockey, which includes the NHL, AHL/IHL, minor pro leagues such as the ECHL, CHL or UHL, or top-division European leagues. If we assume an average wage of $10000 per game in the NHL, $1000 in the AHL, $500 in Europe and $200 in North American minor pro leagues, we get the following average salaries by age:
| Age | Average Salary |
| 20 | 10005 |
| 21 | 16000 |
| 22 | 26047 |
| 23 | 49365 |
| 24 | 46748 |
| 25 | 45529 |
| 26 | 38259 |
| 27 | 35723 |
| 28 | 26437 |
| 29 | 24748 |
The average is of course skewed by players who manage to stay on an NHL roster throughout the entire year. The median salary at ages 23-25 is closer to $20000, since the majority of players play in minor pro leagues. I've introduced a survivor bias here too - barely 5% of AAA Bantam (age 15) players will make the jump to being regular players in Junior or the NCAA and get the opportunity to play professional hockey. Overall, fewer than 1% of top 15-year-olds will ever make the NHL minimum salary of $450000 in a season, and perhaps 3% will make the AHL average of $50000.
Labels: junior hockey
Monday, December 24, 2007
2007-08 4v5 Goaltender Performance
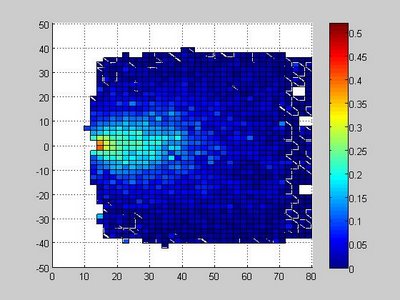
Scoring rates go way up on the power-play, making it a goaltender's toughest assignment. (Ray Emery fighting Andrew Peters doesn't count.) To quantify the difference, here's the same plot as we had for 5-on-5 play, except for 5-on-4:
As you can see, the high-scoring zone is much larger than it is for even-strength play. You can also see that teams don't take a lot of shots from tough angles (I excluded any quadrants with fewer than 10 shots in the last six seasons, resulting in some blank zones). So not only is it easier to score from a given spot on the ice, teams also take more high-probability shots, and average save percentages drop from 915 to 877.
I've reproduced the same chart as in the previous post, showing which goalies reduce their 4v5 goals-against-average by the most. Here we have a minimum of 30 minutes played, so one or two goals can skew the results considerably. Henrik Lundqvist again comes out near the top - is he really that good? Or do MSG scorers consistently report that the puck is shot from closer than it really is? [That's a subject for another post.]
| PLAYER | GP | TOI | SOG | GA | SPCT | GAA | EXGA | EXSPCT | EGAA | DELTAGAA |
| MIKESMITH | 12 | 62:55 | 55 | 4 | 927 | 3.81 | 8.31 | 848 | 7.92 | -4.11 |
| MATHIEUGARON | 18 | 88:58 | 75 | 6 | 920 | 4.04 | 10.8 | 855 | 7.30 | -3.25 |
| FREDRIKNORRENA | 15 | 78:01 | 70 | 4 | 942 | 3.07 | 8.21 | 882 | 6.31 | -3.23 |
| MARTYTURCO | 25 | 131:09 | 124 | 12 | 903 | 5.48 | 18.6 | 849 | 8.55 | -3.06 |
| JONASHILLER | 8 | 40:56 | 42 | 4 | 904 | 5.86 | 5.8 | 861 | 8.50 | -2.63 |
| HENRIKLUNDQVIST | 31 | 160:05 | 144 | 15 | 895 | 5.62 | 21.9 | 847 | 8.21 | -2.59 |
| CHRISOSGOOD | 19 | 105:43 | 80 | 7 | 912 | 3.97 | 11.5 | 855 | 6.55 | -2.58 |
| MIKAELTELLQVIST | 10 | 46:04 | 48 | 4 | 916 | 5.20 | 5.85 | 878 | 7.61 | -2.40 |
| CURTISSANFORD | 8 | 36:56 | 39 | 3 | 923 | 4.87 | 4.39 | 887 | 7.13 | -2.25 |
| TOMASVOKOUN | 32 | 179:50 | 179 | 17 | 905 | 5.67 | 23.4 | 869 | 7.82 | -2.14 |
| BRENTJOHNSON | 9 | 58:27 | 58 | 4 | 931 | 4.10 | 6.06 | 895 | 6.22 | -2.11 |
| NIKOLAIKHABIBULIN | 25 | 143:34 | 126 | 15 | 880 | 6.26 | 19.9 | 841 | 8.32 | -2.06 |
| HANNUTOIVONEN | 10 | 52:55 | 42 | 5 | 880 | 5.66 | 6.59 | 843 | 7.47 | -1.80 |
| MARTINBRODEUR | 30 | 158:20 | 172 | 18 | 895 | 6.82 | 22.6 | 868 | 8.56 | -1.74 |
| JASONLABARBERA | 22 | 96:47 | 113 | 14 | 876 | 8.67 | 16.6 | 852 | 10.3 | -1.66 |
| PASCALLECLAIRE | 23 | 121:46 | 132 | 14 | 893 | 6.89 | 16.9 | 871 | 8.37 | -1.47 |
| MARCDENIS | 10 | 37:04 | 32 | 4 | 875 | 6.47 | 4.8 | 850 | 7.76 | -1.29 |
| EVGENINABOKOV | 35 | 165:43 | 120 | 13 | 891 | 4.70 | 16.5 | 862 | 5.99 | -1.28 |
| MARTINGERBER | 24 | 150:51 | 120 | 13 | 891 | 5.17 | 16.0 | 866 | 6.37 | -1.20 |
| CAREYPRICE | 17 | 85:47 | 115 | 15 | 869 | 10.4 | 16.5 | 856 | 11.5 | -1.07 |
| JOHANHOLMQVIST | 30 | 139:18 | 145 | 17 | 882 | 7.32 | 19.3 | 866 | 8.33 | -1.01 |
| CRISTOBALHUET | 18 | 87:53 | 86 | 10 | 883 | 6.82 | 11.4 | 867 | 7.79 | -0.96 |
| DOMINIKHASEK | 18 | 129:34 | 94 | 13 | 861 | 6.02 | 15.0 | 840 | 6.96 | -0.94 |
| JOSETHEODORE | 15 | 70:08 | 52 | 6 | 884 | 5.13 | 7.09 | 863 | 6.06 | -0.93 |
| RICKDIPIETRO | 32 | 195:02 | 160 | 18 | 887 | 5.53 | 20.8 | 869 | 6.41 | -0.87 |
| DANELLIS | 14 | 70:05 | 55 | 6 | 890 | 5.13 | 6.95 | 873 | 5.95 | -0.81 |
| RYANMILLER | 31 | 188:19 | 163 | 19 | 883 | 6.05 | 20.8 | 872 | 6.62 | -0.57 |
| PATRICKLALIME | 10 | 59:23 | 43 | 6 | 860 | 6.06 | 6.52 | 848 | 6.58 | -0.52 |
| JOSHHARDING | 15 | 70:03 | 85 | 10 | 882 | 8.56 | 10.6 | 875 | 9.07 | -0.51 |
| ANDREWRAYCROFT | 10 | 46:52 | 49 | 6 | 877 | 7.68 | 6.39 | 869 | 8.18 | -0.49 |
| EMMANUELLEGACE | 23 | 141:07 | 85 | 10 | 882 | 4.25 | 11.1 | 869 | 4.73 | -0.48 |
| VESATOSKALA | 29 | 166:53 | 143 | 19 | 867 | 6.83 | 20.2 | 858 | 7.27 | -0.44 |
| TIMOTHY JR.THOMAS | 22 | 105:52 | 113 | 13 | 884 | 7.36 | 13.7 | 878 | 7.80 | -0.44 |
| NIKLASBACKSTROM | 22 | 129:46 | 109 | 14 | 871 | 6.47 | 14.4 | 867 | 6.67 | -0.19 |
| ROBERTOLUONGO | 29 | 164:10 | 161 | 22 | 863 | 8.04 | 22.4 | 860 | 8.21 | -0.17 |
| JOHANHEDBERG | 20 | 95:44 | 91 | 12 | 868 | 7.52 | 12.0 | 867 | 7.54 | -0.02 |
| OLAFKOLZIG | 28 | 160:23 | 168 | 22 | 869 | 8.23 | 21.9 | 869 | 8.22 | 0.003 |
| J-SEBASTIENAUBIN | 13 | 42:18 | 53 | 7 | 867 | 9.92 | 6.96 | 868 | 9.87 | 0.056 |
| RAYEMERY | 12 | 59:40 | 57 | 7 | 877 | 7.03 | 6.87 | 879 | 6.90 | 0.130 |
| ALEXAULD | 15 | 69:40 | 78 | 11 | 858 | 9.47 | 10.6 | 863 | 9.14 | 0.327 |
| DWAYNEROLOSON | 22 | 106:40 | 116 | 17 | 853 | 9.56 | 15.9 | 862 | 8.94 | 0.618 |
| CAMWARD | 27 | 146:32 | 144 | 22 | 847 | 9.00 | 19.9 | 861 | 8.15 | 0.855 |
| MARTINBIRON | 28 | 156:17 | 157 | 21 | 866 | 8.06 | 18.7 | 880 | 7.19 | 0.867 |
| KARILEHTONEN | 13 | 61:16 | 72 | 10 | 861 | 9.79 | 9.05 | 874 | 8.86 | 0.930 |
| DANYSABOURIN | 18 | 76:07 | 76 | 11 | 855 | 8.67 | 9.79 | 871 | 7.71 | 0.953 |
| ILJABRYZGALOV | 25 | 136:19 | 118 | 18 | 847 | 7.92 | 15.8 | 866 | 6.95 | 0.963 |
| CHRISMASON | 24 | 114:03 | 77 | 11 | 857 | 5.78 | 9.06 | 882 | 4.76 | 1.020 |
| JEAN-SEBASTIENGIGUERE | 27 | 159:32 | 156 | 24 | 846 | 9.02 | 21.0 | 864 | 7.92 | 1.101 |
| MARC-ANDREFLEURY | 21 | 98:20 | 104 | 16 | 846 | 9.76 | 13.5 | 869 | 8.28 | 1.482 |
| PETERBUDAJ | 22 | 91:38 | 86 | 15 | 825 | 9.82 | 12.2 | 857 | 8.00 | 1.813 |
| MIIKKAKIPRUSOFF | 35 | 204:31 | 166 | 29 | 825 | 8.50 | 21.3 | 871 | 6.25 | 2.250 |
| ANTERONIITTYMAKI | 8 | 35:56 | 34 | 7 | 794 | 11.6 | 5.08 | 850 | 8.48 | 3.205 |
| JOHNGRAHAME | 11 | 53:52 | 52 | 10 | 807 | 11.1 | 6.71 | 870 | 7.47 | 3.664 |
Labels: Goaltending
Sunday, December 23, 2007
2007-08 5v5 Goaltender Performance
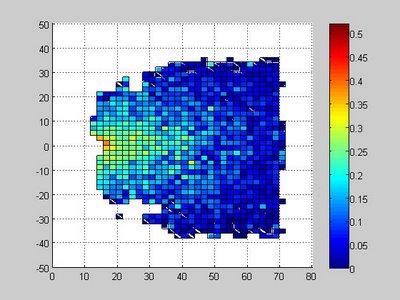
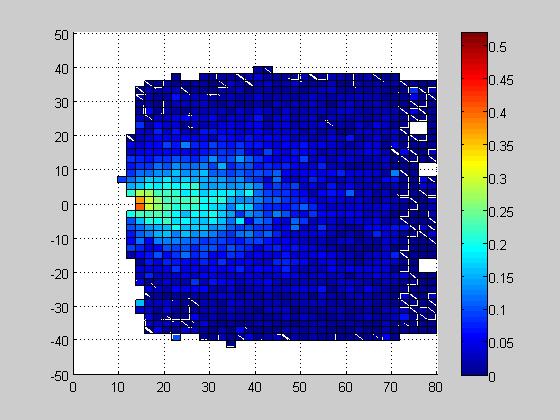
I've put together a simple first-order system to analyze goaltender performance. First, I calculated the probability of scoring from 2x2-foot quadrants using data from 2001 through last week's games:
I then took every shot faced by each goaltender and calculated the number of goals we'd expect an average goaltender to allow is he faced the exact same set of shots. [Note that shot distances are relative to the end boards, not to the goal line.] This is obviously a coarse estimate: we have no information on whether shots were defended or screened, and because of the difference in the way shot types are recorded in different arenas, I haven't differentiated between them. [Yes, in hopes of improving the system, I am happy to accept critical comments!]
At any rate, the table below shows the number of goals allowed by each NHL goaltender this season (minimum: 300 mins) and the expected number of goals allowed by an average goaltender.
So as an example, Henrik Lundqvist has allowed 41 goals on 567 shots at 5-on-5, for a 927 save percentage. However, an average goalie who faced the 567 shots from the same locations would expect to allow 58.3 goals, for an 897 save percentage. On a per-60-minute basis, Lundqvist's Goals-Against-Average is 1.90 - 0.80 goals lower than an average goalie. I'll publish some charts for individual goaltenders so we can compare the best goaltenders to the worst in this metric.
| PLAYER STATS | EXPECTED STATS | |||||||||
| PLAYER | GP | TOI | SOG | GA | SPCT | GAA | EXGA | EXSPCT | EGAA | DELTAGAA |
| TIMOTHY JR.THOMAS | 22 | 977:05 | 521 | 23 | 955 | 1.41 | 44.6 | 914 | 2.74 | -1.32 |
| HENRIKLUNDQVIST | 31 | 1289:26 | 567 | 41 | 927 | 1.90 | 58.3 | 897 | 2.71 | -0.80 |
| CRISTOBALHUET | 18 | 773:04 | 411 | 25 | 939 | 1.94 | 34.9 | 915 | 2.70 | -0.76 |
| ILJABRYZGALOV | 25 | 924:13 | 442 | 25 | 943 | 1.62 | 36.4 | 917 | 2.36 | -0.74 |
| CHRISOSGOOD | 19 | 797:26 | 337 | 22 | 934 | 1.65 | 31.7 | 905 | 2.39 | -0.73 |
| ROBERTOLUONGO | 29 | 1160:50 | 536 | 30 | 944 | 1.55 | 42.7 | 920 | 2.20 | -0.65 |
| MARTINGERBER | 24 | 964:07 | 542 | 38 | 929 | 2.36 | 48.1 | 911 | 2.99 | -0.62 |
| JASONLABARBERA | 22 | 889:57 | 477 | 37 | 922 | 2.49 | 44.3 | 906 | 2.99 | -0.49 |
| EMMANUELLEGACE | 23 | 934:54 | 394 | 28 | 928 | 1.79 | 35.6 | 909 | 2.28 | -0.48 |
| CAREYPRICE | 17 | 728:33 | 386 | 29 | 924 | 2.38 | 34.4 | 910 | 2.83 | -0.44 |
| MARTINBIRON | 28 | 1088:09 | 615 | 41 | 933 | 2.26 | 48.8 | 920 | 2.69 | -0.43 |
| JEAN-SEBASTIENGIGUERE | 27 | 1013:22 | 433 | 31 | 928 | 1.83 | 37.7 | 912 | 2.23 | -0.39 |
| CAMWARD | 27 | 1086:42 | 530 | 41 | 922 | 2.26 | 47.8 | 909 | 2.64 | -0.37 |
| RYANMILLER | 31 | 1254:29 | 602 | 45 | 925 | 2.15 | 51.9 | 913 | 2.48 | -0.33 |
| RICKDIPIETRO | 32 | 1283:57 | 601 | 46 | 923 | 2.14 | 52.4 | 912 | 2.44 | -0.29 |
| DANELLIS | 14 | 502:01 | 230 | 16 | 930 | 1.91 | 18.2 | 920 | 2.18 | -0.27 |
| TOMASVOKOUN | 32 | 1346:02 | 726 | 54 | 925 | 2.40 | 59.7 | 917 | 2.66 | -0.25 |
| VESATOSKALA | 29 | 1168:59 | 554 | 47 | 915 | 2.41 | 52.0 | 906 | 2.66 | -0.25 |
| PASCALLECLAIRE | 23 | 856:31 | 374 | 24 | 935 | 1.68 | 27.0 | 927 | 1.89 | -0.21 |
| NIKLASBACKSTROM | 22 | 894:17 | 394 | 28 | 928 | 1.87 | 30.8 | 921 | 2.07 | -0.19 |
| MIKAELTELLQVIST | 10 | 393:12 | 199 | 15 | 924 | 2.28 | 16.1 | 918 | 2.46 | -0.17 |
| ALEXAULD | 15 | 620:41 | 296 | 22 | 925 | 2.12 | 23.7 | 919 | 2.29 | -0.17 |
| EVGENINABOKOV | 35 | 1446:58 | 607 | 46 | 924 | 1.90 | 49.6 | 918 | 2.05 | -0.14 |
| FREDRIKNORRENA | 15 | 527:50 | 237 | 20 | 915 | 2.27 | 21.0 | 911 | 2.39 | -0.12 |
| MIIKKAKIPRUSOFF | 35 | 1438:23 | 660 | 54 | 918 | 2.25 | 56.8 | 913 | 2.37 | -0.11 |
| MARTINBRODEUR | 30 | 1286:11 | 531 | 44 | 917 | 2.05 | 46.4 | 912 | 2.16 | -0.11 |
| NIKOLAIKHABIBULIN | 25 | 970:42 | 421 | 39 | 907 | 2.41 | 40.4 | 903 | 2.49 | -0.08 |
| PATRICKLALIME | 10 | 390:04 | 167 | 15 | 910 | 2.30 | 15.4 | 907 | 2.37 | -0.07 |
| MARC-ANDREFLEURY | 21 | 760:41 | 388 | 32 | 917 | 2.52 | 32.4 | 916 | 2.55 | -0.03 |
| KARILEHTONEN | 13 | 472:40 | 250 | 22 | 912 | 2.79 | 22.2 | 911 | 2.82 | -0.03 |
| JOHNGRAHAME | 11 | 435:36 | 238 | 22 | 907 | 3.03 | 22.2 | 906 | 3.06 | -0.03 |
| PETERBUDAJ | 22 | 906:00 | 419 | 35 | 916 | 2.31 | 35.0 | 916 | 2.32 | -0.00 |
| MARTYTURCO | 25 | 1082:27 | 473 | 40 | 915 | 2.21 | 39.3 | 916 | 2.17 | 0.037 |
| JOSHHARDING | 15 | 579:25 | 313 | 25 | 920 | 2.58 | 23.6 | 924 | 2.45 | 0.138 |
| DOMINIKHASEK | 18 | 656:53 | 207 | 19 | 908 | 1.73 | 17.2 | 916 | 1.57 | 0.160 |
| MATHIEUGARON | 18 | 686:55 | 327 | 31 | 905 | 2.70 | 28.7 | 911 | 2.51 | 0.193 |
| RAYEMERY | 12 | 432:39 | 176 | 16 | 909 | 2.21 | 14.4 | 918 | 2.00 | 0.217 |
| CURTISSANFORD | 8 | 316:27 | 151 | 13 | 913 | 2.46 | 11.7 | 922 | 2.22 | 0.235 |
| OLAFKOLZIG | 28 | 1175:33 | 510 | 52 | 898 | 2.65 | 47.2 | 907 | 2.41 | 0.242 |
| DANYSABOURIN | 18 | 650:38 | 316 | 31 | 901 | 2.85 | 28.3 | 910 | 2.61 | 0.248 |
| DWAYNEROLOSON | 22 | 852:05 | 463 | 42 | 909 | 2.95 | 38.4 | 916 | 2.70 | 0.250 |
| CHRISMASON | 24 | 877:12 | 434 | 45 | 896 | 3.07 | 39.8 | 908 | 2.72 | 0.350 |
| BRENTJOHNSON | 9 | 344:40 | 165 | 17 | 896 | 2.95 | 14.7 | 910 | 2.57 | 0.386 |
| MIKESMITH | 12 | 465:48 | 206 | 22 | 893 | 2.83 | 18.9 | 907 | 2.44 | 0.387 |
| HANNUTOIVONEN | 10 | 394:32 | 195 | 22 | 887 | 3.34 | 19.1 | 901 | 2.90 | 0.436 |
| JOHANHEDBERG | 20 | 795:09 | 419 | 42 | 899 | 3.16 | 35.3 | 915 | 2.66 | 0.499 |
| JOSETHEODORE | 15 | 618:30 | 280 | 34 | 878 | 3.29 | 26.4 | 905 | 2.56 | 0.736 |
| JOHANHOLMQVIST | 30 | 1190:12 | 508 | 58 | 885 | 2.92 | 43.2 | 914 | 2.18 | 0.741 |
| J-SEBASTIENAUBIN | 13 | 427:15 | 214 | 24 | 887 | 3.37 | 17.9 | 916 | 2.52 | 0.848 |
| ANDREWRAYCROFT | 10 | 344:49 | 166 | 19 | 885 | 3.30 | 13.5 | 918 | 2.36 | 0.941 |
Labels: Goaltending
Thursday, December 20, 2007
Shooting Percentage by Zone
I spend a lot of time looking at the NHL's data feed, and sometimes I forget that there's often more data available on ESPN's feed. In particular, while the NHL still only gives you shot distance but no angle information, this season, ESPN has the coordinates of every shot on goal. Here's last night's Anaheim-Colorado game, for example. This just serves to remind us that there's a lot more data being collected at every game than we could possibly imagine just from what's publicly-available.
At any rate, one of the things we'd like to know is how often a shot goes in from a given zone on the ice. This plot shows that percentage for even-strength and power-play situations:
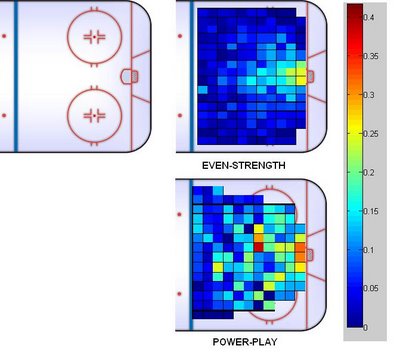
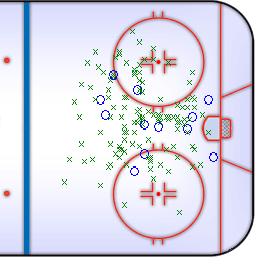
Note that if there were fewer than 20 shots taken so far this season in a given zone, it is not shown. Obviously, there's a tremendous amount we can do with this data, and I'm hoping to get around to that as soon as possible. In the interim, here are some sample shooting scatterplots, starting with the much-maligned Michael Ryder's even-strength shooting:

Compare to the somewhat inefficient Alexander Ovechkin at evens:
That's all for now. Much more later. If there's any shooting analysis you'd like to see, please post a comment.
At any rate, one of the things we'd like to know is how often a shot goes in from a given zone on the ice. This plot shows that percentage for even-strength and power-play situations:

Note that if there were fewer than 20 shots taken so far this season in a given zone, it is not shown. Obviously, there's a tremendous amount we can do with this data, and I'm hoping to get around to that as soon as possible. In the interim, here are some sample shooting scatterplots, starting with the much-maligned Michael Ryder's even-strength shooting:
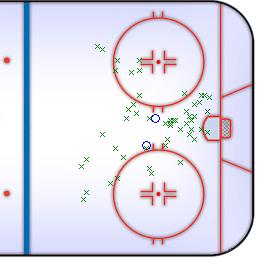
Compare to the somewhat inefficient Alexander Ovechkin at evens:

That's all for now. Much more later. If there's any shooting analysis you'd like to see, please post a comment.
Labels: Shooting
Wednesday, December 19, 2007
The "Nothing" Line
Anaheim is one of the last teams to use a real checking line as its third line. Last season, the Niedermayer-Pahlsson-Moen combination played together almost 90% of the time. Injuries at the beginning of the 2007-08 season forced a mix-up for a few games, but the trio has been re-united for the last 30 games.
It's interesting to watch this line play because they are exceptionally good at forechecking and shutting down the opposing team's offense. Pahlsson has given up a few extra goals this season, but they are all among the league leaders in preventing the other team from scoring, this despite facing the other team's top lines every night.
On the other side of the puck, they also produce next to no goals. All three players are in the bottom 2% among scorers this season. Moen, in particular, is in the 99th percentile, league-wide, both in preventing the other team from scoring and in not scoring himself.
I remark on this because I've watched three Sharks-Ducks games in the last three weeks. Two of these games ended up 1-1, the other 2-0, thanks in no small part to Anaheim's traditional checking line, which made sure nothing happened when they were on the ice. It's not the "new NHL", but it does make for some interesting statistics.
It's interesting to watch this line play because they are exceptionally good at forechecking and shutting down the opposing team's offense. Pahlsson has given up a few extra goals this season, but they are all among the league leaders in preventing the other team from scoring, this despite facing the other team's top lines every night.
On the other side of the puck, they also produce next to no goals. All three players are in the bottom 2% among scorers this season. Moen, in particular, is in the 99th percentile, league-wide, both in preventing the other team from scoring and in not scoring himself.
| NAME | POS | TEAM | GP | TOI/60 | QUALCOMP | GFON/60 | GAON/60 |
| SAMUEL PAHLSSON | C | ANA | 30 | 12.84 | 0.26 | 1.09 | 1.87 |
| ROB NIEDERMAYER | C | ANA | 32 | 11.85 | 0.22 | 0.79 | 1.42 |
| TRAVIS MOEN | LW | ANA | 34 | 12.44 | 0.22 | 0.71 | 0.99 |
| LEAGUE AVERAGE | 2.40 | 2.40 |
I remark on this because I've watched three Sharks-Ducks games in the last three weeks. Two of these games ended up 1-1, the other 2-0, thanks in no small part to Anaheim's traditional checking line, which made sure nothing happened when they were on the ice. It's not the "new NHL", but it does make for some interesting statistics.
Labels: Checking Lines
Monday, December 17, 2007
Starting in the NHL as a teenager does mean success
"Getting to the big time early doesn't necessarily mean you've made it big. Or to stay." - Damien Cox, ESPN.com, 12/12/07 in Starting in NHL as a teenager doesn't mean instant success.
Sometimes you run across something that's so illogical, it must be true. And Damien Cox's article on ESPN was one of those jarring ideas: young players who make it to the NHL before their 20th birthdays aren't necessarily guaranteed of a good career - and it takes years to know whether they'll be any good.
Cox presents what seems like plausible evidence: looking at the 1999 season, not every player who made the NHL as a teenager turned into a superstar. While this group included Vincent Lecavalier, Simon Gagne and Scott Gomez, it also featured Manny Malhotra, Brad Stuart, Martin Skoula, Rico Fata, Mathieu Biron, Artem Chubarov, Steve McCarthy, Oleg Saprykin and David Tanabe.
So Cox concludes: "There's no discernible trend, other than to say, based on that group of players, being in the NHL by 18 or 19 is no guarantee of future success."
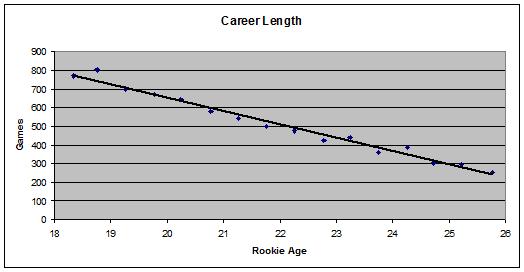
Well, maybe that's true, but let's extend our analysis beyond counting the number of "stars" in a single draft class and include every player who started his NHL career after 1967. Here we see the average career length based on a player's age on January 1st of his rookie NHL season:
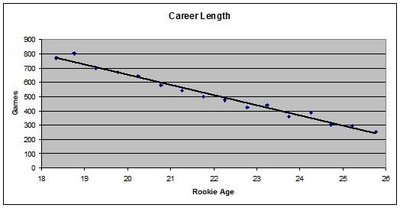
The result is pretty clear: for every year older a player is when he debuts, he can expect to play 73 fewer games in his career. In other words, a 19-year-old rookie can expect to play until he's 29, and a 21-year-old rookie will also expect to play until he's 29. Starting late has no effect on when a player's career is over*.
But maybe longevity doesn't translate to scoring prowess? We can use career points-per-game (PPG) to estimate offensive skill:
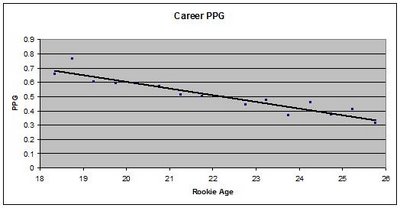
Again, the younger a player is when he starts out, the higher his rate of offensive production.
Well, what about Cox's assertion that it takes years for teenage rookies to establish themselves as good player? We can look at the year-over-year change in PPG for these players:
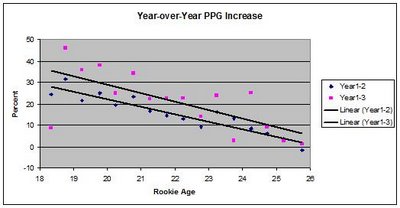
Again, the general trend is higher as a player gets younger: older players improve their skills less from year-to-year than younger ones. But we already knew that. It's true of 20-year-old juniors vs 18-year-old juniors, so why wouldn't it be true of 18- and 20-year-old pros?
Unfortunately, to claim otherwise, we need to take a leap based on a small amount of non-quantitative evidence. While there's no guarantee that teenage rookies will turn into superstars, the younger a player is on average when he makes the bigs, the better his career will turn out to be. However many high draft pick busts there are, they don't outweigh the huge number of successful players who hit the NHL in their teens.
* - The youngest age group, which was no older than 18 years and 3 months when the season starts actually performs slightly poorer than the group that's six months older. This is because of small sample size: all other groups include 6 months of birthdays, while this group only includes three months of player since they needed to be 18 on the day the season started. This group also includes Sidney Crosby and Patrice Bergeron, who will most certainly skew this group upwards as their careers progress.
Sometimes you run across something that's so illogical, it must be true. And Damien Cox's article on ESPN was one of those jarring ideas: young players who make it to the NHL before their 20th birthdays aren't necessarily guaranteed of a good career - and it takes years to know whether they'll be any good.
Cox presents what seems like plausible evidence: looking at the 1999 season, not every player who made the NHL as a teenager turned into a superstar. While this group included Vincent Lecavalier, Simon Gagne and Scott Gomez, it also featured Manny Malhotra, Brad Stuart, Martin Skoula, Rico Fata, Mathieu Biron, Artem Chubarov, Steve McCarthy, Oleg Saprykin and David Tanabe.
So Cox concludes: "There's no discernible trend, other than to say, based on that group of players, being in the NHL by 18 or 19 is no guarantee of future success."
Well, maybe that's true, but let's extend our analysis beyond counting the number of "stars" in a single draft class and include every player who started his NHL career after 1967. Here we see the average career length based on a player's age on January 1st of his rookie NHL season:
The result is pretty clear: for every year older a player is when he debuts, he can expect to play 73 fewer games in his career. In other words, a 19-year-old rookie can expect to play until he's 29, and a 21-year-old rookie will also expect to play until he's 29. Starting late has no effect on when a player's career is over*.
But maybe longevity doesn't translate to scoring prowess? We can use career points-per-game (PPG) to estimate offensive skill:
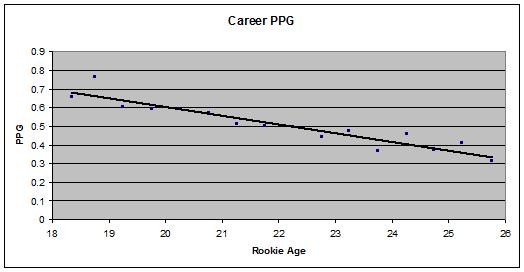
Again, the younger a player is when he starts out, the higher his rate of offensive production.
Well, what about Cox's assertion that it takes years for teenage rookies to establish themselves as good player? We can look at the year-over-year change in PPG for these players:
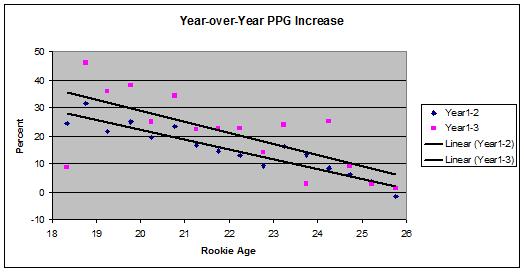
Again, the general trend is higher as a player gets younger: older players improve their skills less from year-to-year than younger ones. But we already knew that. It's true of 20-year-old juniors vs 18-year-old juniors, so why wouldn't it be true of 18- and 20-year-old pros?
Unfortunately, to claim otherwise, we need to take a leap based on a small amount of non-quantitative evidence. While there's no guarantee that teenage rookies will turn into superstars, the younger a player is on average when he makes the bigs, the better his career will turn out to be. However many high draft pick busts there are, they don't outweigh the huge number of successful players who hit the NHL in their teens.
* - The youngest age group, which was no older than 18 years and 3 months when the season starts actually performs slightly poorer than the group that's six months older. This is because of small sample size: all other groups include 6 months of birthdays, while this group only includes three months of player since they needed to be 18 on the day the season started. This group also includes Sidney Crosby and Patrice Bergeron, who will most certainly skew this group upwards as their careers progress.
Labels: ESPN, Projections
Tuesday, December 11, 2007
Behindthenet on NY Times Slapshot Blogroll
Now the New York Times is hardly the arbiter of hockey, but they were nice enough to put Behindthenet on their NY Times Slapshot Blogroll. And of course, we're first on the list due to alphabetical billing...
It's actually a pretty strange list - excluding the major sports sites (ESPN, NHL.com, etc), the local newspapers, local New York team blogs and the US and Canadian national team sites, they have:
Behind the Net
Deadspin.com
Goonblog.com
Hockey's Future
HockeyNation.com
James Mirtle's Hockey Blog
Timeonice.com
An interesting list, to say the least...
Labels: website
Thursday, December 6, 2007
Player Log List now sortable by team
Again, easier on the eyes...Check out:
http://behindthenet.ca/2007/players.php
If there's anything else you think should be on the site, let me know...
http://behindthenet.ca/2007/players.php
If there's anything else you think should be on the site, let me know...
Labels: website
Wednesday, December 5, 2007
Leader Board: Times a player's shot was blocked, 5-on-5
This is the first year that the NHL has listed whose shot was blocked in their feed. Alexander Ovechkin leads #2 Heatley by a huge margin - after Heatley, I removed a lot of defensemen who are more likely to have their shots blocked. At any rate, it's interesting to see a new stat, and to see yet another player have more than double the second-place guy in a counting stat...
Forwards only
OVECHKIN 74
HEATLEY 34
SATAN 28
O. JOKINEN 28
KOVALCHUK 27
J. WILLIAMS 27
BLAKE 27
HALPERN 26
B. RICHARDS 26
ZETTERBERG 24
RYDER 24
HEMSKY 24
Forwards only
OVECHKIN 74
HEATLEY 34
SATAN 28
O. JOKINEN 28
KOVALCHUK 27
J. WILLIAMS 27
BLAKE 27
HALPERN 26
B. RICHARDS 26
ZETTERBERG 24
RYDER 24
HEMSKY 24
Labels: Blocked Shots
Tuesday, December 4, 2007
More refinements
Not everybody wants to cut and paste the entire stats database into a spreadsheet just to be able to sort their favorite team's players. So you now have the ability to select only one particular team's stats.
So if you wanted to see if Bryan McCabe is still killing the Leafs, you could do this:
http://www.behindthenet.ca/2007/5_on_5.php?sort=18&mingp=20&mintoi=&team=TOR
Much easier on the eyes...
The width of the stats database is also becoming a pain, so I split some of the stats into separate pieces, penalties here, e.g.:
http://www.behindthenet.ca/2007/5_on_5_pens.php?sort=8&mingp=&mintoi=10
Also easier on the eyes...More to come as I find time - I really need to hire a kid to make my web pages so I can concentrate on the data...
Labels: website
Monday, December 3, 2007
Lay off Patrick Marleau
San Jose Sharks Captain Patrick Marleau has been taking a lot of flak for his play this year, and it's true, it all you looked at were his most basic stats, it doesn't seem like he's having a good year:
YEAR TEAM GP G A PTS SOG SPCT ESG ESA PPG PPA
2005-2006 SAN 82 34 52 86 260 13.1 14 28 20 24
2006-2007 SAN 77 32 46 78 180 17.8 18 23 14 23
2007-2008 SAN 24 4 7 11 46 8.7 4 3 0 4
But we can't honestly believe Marleau will continue to score on just 8.7% of his shots, half of his career level, can we? When questioned by the San Jose Mercury News, Marleau doesn't believe it:
"The puck just isn't going into the net," Marleau said. "It's just one of those things that comes and goes. But it's not going to stay this way..."
One thing Marleau does exceedingly well is draw penalties. He was the best in the league (per 60 minutes) last season, and he's the best this season. And it's not even close. He draws penalties with speed and great moves - and that hasn't changed. There is no reason to think Marleau won't rack up a ton of points both at even-strength and on the power-play going forward.
![]()
Subscribe to Posts [Atom]
