Thursday, December 20, 2007
Shooting Percentage by Zone
I spend a lot of time looking at the NHL's data feed, and sometimes I forget that there's often more data available on ESPN's feed. In particular, while the NHL still only gives you shot distance but no angle information, this season, ESPN has the coordinates of every shot on goal. Here's last night's Anaheim-Colorado game, for example. This just serves to remind us that there's a lot more data being collected at every game than we could possibly imagine just from what's publicly-available.
At any rate, one of the things we'd like to know is how often a shot goes in from a given zone on the ice. This plot shows that percentage for even-strength and power-play situations:
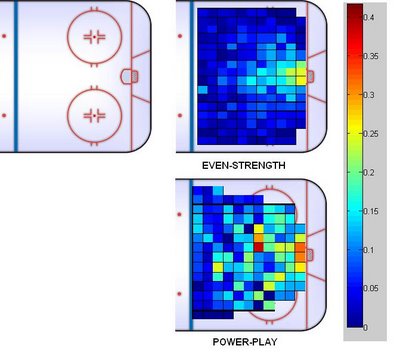
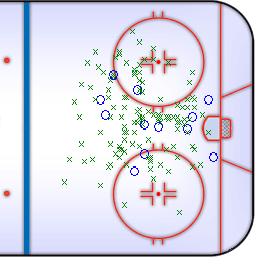
Note that if there were fewer than 20 shots taken so far this season in a given zone, it is not shown. Obviously, there's a tremendous amount we can do with this data, and I'm hoping to get around to that as soon as possible. In the interim, here are some sample shooting scatterplots, starting with the much-maligned Michael Ryder's even-strength shooting:

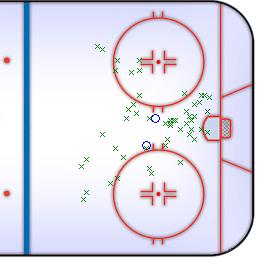
Compare to the somewhat inefficient Alexander Ovechkin at evens:
That's all for now. Much more later. If there's any shooting analysis you'd like to see, please post a comment.
At any rate, one of the things we'd like to know is how often a shot goes in from a given zone on the ice. This plot shows that percentage for even-strength and power-play situations:

Note that if there were fewer than 20 shots taken so far this season in a given zone, it is not shown. Obviously, there's a tremendous amount we can do with this data, and I'm hoping to get around to that as soon as possible. In the interim, here are some sample shooting scatterplots, starting with the much-maligned Michael Ryder's even-strength shooting:
Compare to the somewhat inefficient Alexander Ovechkin at evens:

That's all for now. Much more later. If there's any shooting analysis you'd like to see, please post a comment.
Labels: Shooting
// posted by Hawerchuk @ 1:08 PM 
Comments:
Links to this post:
<< Home
Hmmmm any interesting learnings on a per-goalie basis? In other words, any goalies have a strange weak spot like from the hashmarks on the outside of the left face-off circle?

Have you checked how that data feed compares to the play-by-play files? I know when I looked at them last year they were wildly off base. If the quality of that data has improved, it would be a tremendously useful new tool for sure...
Since we don't have a ton of shooter data, I will be looking at goalies. More on that soon.
The ESPN shot data appears to come from the same XML file as the one that builds the PBP. I'll do a post on how well they match.
The ESPN shot data appears to come from the same XML file as the one that builds the PBP. I'll do a post on how well they match.
Hmm, could I ask for 4-on-5 charts (goal and shot against frequency) for SJ, ANA, and LAK? Or is that pushing it?
I'd be interested to know how well they matched up, too. When I checked this stuff last year, there were terrible inconsistencies.
I have 507 games in the NHL database today (I have a bunch of NHL summaries to fix...)
457 agree on the number of goals and number of shots with the ESPN shot database. Another 38 agree on goals but disagree on shoots (stdev = 2.9 shots in those games).
There are 12 games that disagree on the number of goals. Two of them are on ESPN's side (271030019 and 271129022, if you want to figure out where that goal went). There was one total garbage game on my end (20040). A bunch were a mistake I made last week which I will fix...
I audited one random game (20016) and every piece of data was identical. Seems good enough to me - more accurate than the NHL's database has been in the past!
A few of these games are completely off. One of the in particular was the Kings vs. Sabres game (or was it the Sabres vs. Sharks?) that featured 7 goals from the blue crease area when in fact watching the hilights that wasn't the case at all.
I swear the older RTSS data had position data because I've seen it listed in older sites. Why did they get rid of it?
I swear the older RTSS data had position data because I've seen it listed in older sites. Why did they get rid of it?
I recently did a statistical assessment using 81 NHL game shot against stats. I came up with a standard for goals/shot/zone based on distance to the net thereby using reaction time and exposed net percentage. I would love to send you the chart I now use it to teach coaches in the Hockey Canada coaching clinics I instruct. send me your email address and I will send you the attachment
Post a Comment
Links to this post:
<< Home
![]()
Subscribe to Posts [Atom]
