Wednesday, April 29, 2009
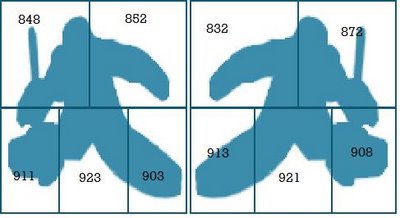
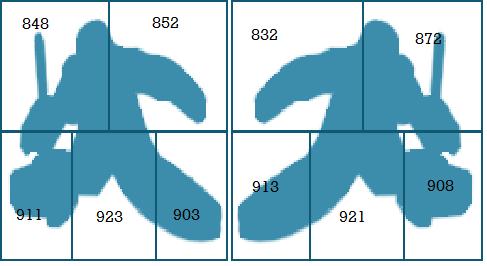
Shooting Percentage by Location of Directed Shot
Here's the save percentage by right- and left-handed goalies during the 2008-09 season:
I'll admit that I'm not completely sure what's interesting about this data - I have it for every goaltender and every shooter - so if you've got a good idea, send it my way.
Update: Hockey Numbers was all over this back in 2007. The 2006-07 data is no longer available, oddly enough.
I'll admit that I'm not completely sure what's interesting about this data - I have it for every goaltender and every shooter - so if you've got a good idea, send it my way.
Update: Hockey Numbers was all over this back in 2007. The 2006-07 data is no longer available, oddly enough.
Labels: Goaltending
// posted by Hawerchuk @ 12:37 AM 
Comments:
Links to this post:
<< Home

Thats awesome! How did you get the data? I have been on a kick lately to compile as much hockey data as possible just to play around with various ideas I have (I am sure alot of it has been done already - I just want to try).
Many thanks. Keep up the great work!
Many thanks. Keep up the great work!
Olivier - it's on CBS Sportsline.
Take a look at the shot chart here:
http://www.cbssports.com/nhl/gamecenter/live/NHL_20081104_NYI@NYR
If you float over a shot, it'll show you where it was directed at the goalie.
Take a look at the shot chart here:
http://www.cbssports.com/nhl/gamecenter/live/NHL_20081104_NYI@NYR
If you float over a shot, it'll show you where it was directed at the goalie.
Hawerchuk, it is very interesting data. I am not sure what are the numbers on the picture you've posted. Shooting % is < 1.
It would be interesting to learn from your analysis the following:
1) how many left handed goalies according to your statistics? I know there are only 3 left handed starters in NHL.
2) How many left and right handed goalies have better Sv% on the glove side than on the blocker side (zone 1 and 2)?
3) What is the average number of shots per game in the zone 1 and 2 with respect to the knowledge which Sv% is higher?
I can keep going with my questions :)
Thank you
yeah, should have been save pct, not shooting pct.
1) There were 15 right-catching goalies or so. I can't remember how many shots they saw, but it was a not-insignificant percentage of the league total. I'll check.
2) Small sample size, one year's worth of shots per goalie...Not sure we can draw a conclusion.
3) Again, I'll check.
1) There were 15 right-catching goalies or so. I can't remember how many shots they saw, but it was a not-insignificant percentage of the league total. I'll check.
2) Small sample size, one year's worth of shots per goalie...Not sure we can draw a conclusion.
3) Again, I'll check.
1) It's ok to look at statistics when you have at least 100 shots per each zone for a goalie. How many left and right goalies in your analyzes fit this requirement?
2)Among those from above how many have Glove Sv% > Blocker Sv%? According to your total results right handed goalies have Glove Sv% > Blocker Sv% (seems logical), however left-handed goalies have an opposite situation. Is that right???
2)Among those from above how many have Glove Sv% > Blocker Sv%? According to your total results right handed goalies have Glove Sv% > Blocker Sv% (seems logical), however left-handed goalies have an opposite situation. Is that right???
1) I disagree. The upper quadrants don't get shot at anywhere near as often as the lowers. A variation of 2 shots per 100 would completely change the results.
2) The data appears to show that right-handed catching goalies get beat glove side more than blocker side, but that there's no difference for left-catchers. This may be due to most players being left-handed shots...Or having too few right-handed catchers. But I wouldn't draw too many conclusions.
2) The data appears to show that right-handed catching goalies get beat glove side more than blocker side, but that there's no difference for left-catchers. This may be due to most players being left-handed shots...Or having too few right-handed catchers. But I wouldn't draw too many conclusions.
Right catchers: Vokoun, Steve Mason, Theodore, Hiller, Garon, Droiun-Deslauriers, McElhinney, DiPietro, Schwarz. So 9 total, accounting for ~10% of total shots against.
Among the 26 lefties who faced 200+ high shots, the average difference in shooting percentage between high left and high right was 0.18% (to the left, but it's meaningless.) 13 goalies were above and 13 were below.
I don't really find this information all that exciting - if you'd like the raw data, I'll email it to you.
I've looked at this data as well in smaller samples and through the work done at Hockey Numbers. I don't think the specific location matters much at all. Blocker vs. glove seems to be splitting hairs for most guys, except a couple here and there that have an apparent weakness (even that might be randomness though).
I think the key split is high vs. low. Because of the large difference in expected save percentage between a high shot and a low shot, I'd probably be more interested in the frequency of high shots against goalies than their individual save percentages. That would give us more of sense of who is facing more difficult shots.
Unfortunately, it looks to me like there are some reporting issues with the data, a lot of variance from rink to rink.
Who does CBS get to record this stuff, anyways? I'm guessing they get a press pass and laptop to a local guy and let them have a go.
I know they record as they go, then go back and rationalize it with the NHL.com data after the fact.
I watched as they came up for an Oiler game once, and the guy doing it here must have been high. I doubt he was within 10 feet of the shot loaction most of the time. There was a shot that hit the goalie in the mask and it counted as a pad save. The whole thing was a complete mess.
So ignore Edmonton's data. Or check along as a game is played and see if he's gotten any better.
Post a Comment
I know they record as they go, then go back and rationalize it with the NHL.com data after the fact.
I watched as they came up for an Oiler game once, and the guy doing it here must have been high. I doubt he was within 10 feet of the shot loaction most of the time. There was a shot that hit the goalie in the mask and it counted as a pad save. The whole thing was a complete mess.
So ignore Edmonton's data. Or check along as a game is played and see if he's gotten any better.
Links to this post:
<< Home
![]()
Subscribe to Posts [Atom]
