Sunday, August 2, 2009
Giveaways
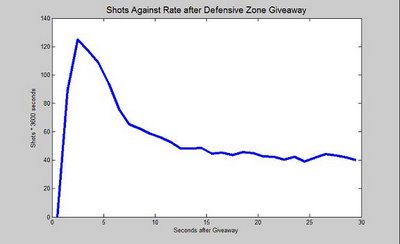
Not surprisingly, giveaways have a highly-negative defensive impact. The peak shot rate against following a giveaway is as high as during a 5-on-3:
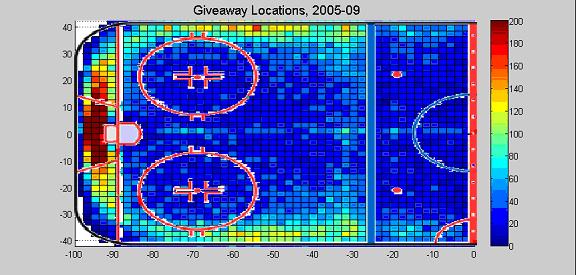
Of course, not all defensive zone giveaways are the same. As you can see from the chart, the vast majority of giveaways occur behind the net and along the boards. It’s not clear whether scorers consistently record the location where the puckhandler gave the puck away, or where the opposing team picked up the turnover. However, since most turnovers occurred behind the goal, it is unlikely that we are substantially undercounting giveaways in the slot, for example, so the chart likely captures the actual distribution of giveaway locations.

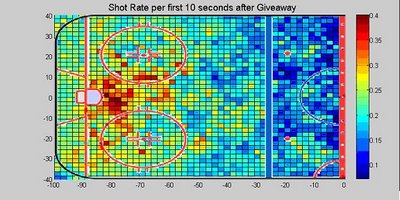
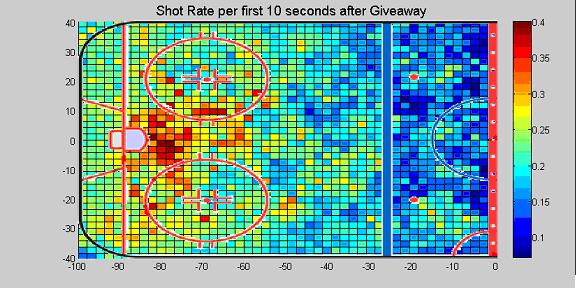
The defensive cost of a giveaway has a slightly different profile. While giveaways behind the net or along the boards result in a shot against over the next 10 seconds of play about 25% of the time, giveaways in front of the goal are (not surprisingly) almost twice as likely to result in a shot.

Of course, not all defensive zone giveaways are the same. As you can see from the chart, the vast majority of giveaways occur behind the net and along the boards. It’s not clear whether scorers consistently record the location where the puckhandler gave the puck away, or where the opposing team picked up the turnover. However, since most turnovers occurred behind the goal, it is unlikely that we are substantially undercounting giveaways in the slot, for example, so the chart likely captures the actual distribution of giveaway locations.
The defensive cost of a giveaway has a slightly different profile. While giveaways behind the net or along the boards result in a shot against over the next 10 seconds of play about 25% of the time, giveaways in front of the goal are (not surprisingly) almost twice as likely to result in a shot.
Labels: Giveaways
// posted by Hawerchuk @ 9:40 PM 
Comments:
Links to this post:
<< Home
Gorgeous chart. And probably the best uses that can be made of those particular stats, that is putting up a league-wide profile. Still, I wonder: I've been trying to acquire some form of web-scraping fu, and tough I don't have achieved much yet, I could still garner this distribution of giveaways by home arena from the Play-By-Play data:
N --- Home arena
1274 Edmonton Oilers
1187 Montreal Canadiens
1162 Washington Capitals
1103 Philadelphia Flyers
1101 Los Angeles Kings
992 San Jose Sharks
985 Toronto Maple Leafs
973 Dallas Stars
906 Buffalo Sabres
892 new york islanders
846 Ottawa Senators
754 Colorado avalanches
719 Anaheim Ducks
698 Nashville Predators
686 Calgary Flames
684 Tampa Bay Lightning
576 Vancouver Canucks
548 Minnestoa Wild
499 Detroit red wings
471 ATLANTA THRASHERS
467 Pittsburgh Penguins
461 Florida Panthers
409 New Jersey Devils
407 ST. LOUIS BLUES
353 Carolina Hurricanes
324 New york rangers
302 Boston Bruins
276 Chicago Blackhawks
247 Colombus Blue Jackets
191 Phoenix Coyotes
Basically, that means there were 191 giveaways scored in phoenix (both for the yotes and their opponents) over the course of last season.

Gorgeous chart. And probably the best uses that can be made of those particular stats, that is putting up a league-wide profile. Still, I wonder: I've been trying to acquire some form of web-scraping fu, and tough I don't have achieved much yet, I could still garner this distribution of giveaways by home arena from the Play-By-Play data:
N --- Home arena
1274 Edmonton Oilers
1187 Montreal Canadiens
1162 Washington Capitals
1103 Philadelphia Flyers
1101 Los Angeles Kings
992 San Jose Sharks
985 Toronto Maple Leafs
973 Dallas Stars
906 Buffalo Sabres
892 new york islanders
846 Ottawa Senators
754 Colorado avalanches
719 Anaheim Ducks
698 Nashville Predators
686 Calgary Flames
684 Tampa Bay Lightning
576 Vancouver Canucks
548 Minnestoa Wild
499 Detroit red wings
471 ATLANTA THRASHERS
467 Pittsburgh Penguins
461 Florida Panthers
409 New Jersey Devils
407 ST. LOUIS BLUES
353 Carolina Hurricanes
324 New york rangers
302 Boston Bruins
276 Chicago Blackhawks
247 Colombus Blue Jackets
191 Phoenix Coyotes
Basically, that means there were 191 giveaways scored in phoenix (both for the yotes and their opponents) over the course of last season.
Post a Comment
N --- Home arena
1274 Edmonton Oilers
1187 Montreal Canadiens
1162 Washington Capitals
1103 Philadelphia Flyers
1101 Los Angeles Kings
992 San Jose Sharks
985 Toronto Maple Leafs
973 Dallas Stars
906 Buffalo Sabres
892 new york islanders
846 Ottawa Senators
754 Colorado avalanches
719 Anaheim Ducks
698 Nashville Predators
686 Calgary Flames
684 Tampa Bay Lightning
576 Vancouver Canucks
548 Minnestoa Wild
499 Detroit red wings
471 ATLANTA THRASHERS
467 Pittsburgh Penguins
461 Florida Panthers
409 New Jersey Devils
407 ST. LOUIS BLUES
353 Carolina Hurricanes
324 New york rangers
302 Boston Bruins
276 Chicago Blackhawks
247 Colombus Blue Jackets
191 Phoenix Coyotes
Basically, that means there were 191 giveaways scored in phoenix (both for the yotes and their opponents) over the course of last season.
Links to this post:
<< Home
![]()
Subscribe to Posts [Atom]
