Friday, August 28, 2009
Defensive Systems and their Impact on Shot Location
As we saw a few weeks ago, Jacques Lemaire’s defensive system substantially limits the rate at which opponents take high-percentage shots against his teams. This effect has been persistent over the course of nearly a decade. This made me wonder what impact other coaches have on shots faced by their teams.
What the chart below shows is - for each coach in all years that he coached - the difference between league-wide save percentage and the save percentage each team expected given the shots they allowed.
As you can see, Lemaire stands out, though it would be interesting to see how the shot location chart looks for Hitchcock's teams. Bob Hartley brings up the rear for coaches who coached four seasons or more - his poor performance may be entirely due to having Ilya Kovalchuk on the ice most of the game.
What the chart below shows is - for each coach in all years that he coached - the difference between league-wide save percentage and the save percentage each team expected given the shots they allowed.
Coach      +EXS% YRS
Lemaire     4.3  7
Hitchcock   3.4  5
B. Sutter   2.8  5
Mactavish   2.0  7
Julien      2.0  4
Trotz       1.7  7
Martin      1.3  6
Wilson      1.2  6
Ruff        0.9  7
Quinn       0.8  4
Tippett     0.3  6
Crawford   -0.8  6
Tortorella -1.0  6
Maurice    -1.0  4
Carlyle    -1.3  4
Gretzky    -1.5  4
Quenneville-1.7  6
A. Murray  -2.3  6
Babcock    -2.3  6
Laviolette -3.2  5
Hartley    -3.5  4
As you can see, Lemaire stands out, though it would be interesting to see how the shot location chart looks for Hitchcock's teams. Bob Hartley brings up the rear for coaches who coached four seasons or more - his poor performance may be entirely due to having Ilya Kovalchuk on the ice most of the game.
Monday, August 24, 2009
OHL 2003-04 Quality of Competition
Following up on this table, here are 5v5 Quality of Competition percentiles for each of the players. (Quality of Competition is calculated using Willis' method with the following modifications - only 5v5 points are included, and all opponents are included, not just forwards.)
Rob Schremp appears to have been sheltered...
Rob Schremp appears to have been sheltered...
Player QoC  GP-G-A1-A2   +/-
Wolski   86  65-19-13-6   42/42
Schremp  41  63-12- 5-8   34/13
Bolland  83  65-14- 9-5   32/19
Bickel   32  56-14- 5-3   32/36
Garlock  95  51-8- 14-7   36/20
Berti    78  64-6- 11-7   38/35
Meidl    82  66-5-  7-7   33/29
Kennedy  85  62-11-11-4   38/36
Reddox   82  66-15-10-6   39/41
McGrath  96  67-10-11-9   45/43
Kell     69  62-7-  8-5   26/14
Pisellini67  67-4-  3-4   25/17
Haskins  78  61-5-  9-2   28/14
Kaleta   56  65-4-  4-4   18/34
Rizk     92  67-5-  6-4   21/33
Morrison 45  64-10- 7-7   38/31
Pitton   79  66-8-  3-4   25/36
Stewart   9  57-4-  4-2   14/23
Labels: junior hockey, Quality of Competition
Wednesday, August 19, 2009
New Puck Prospectus Article: Shot Quality and the Minnesota Wild
Niklas Backstrom is a mystery to me - is he a great goalie? Or did Minnesota limit his exposure. The Wild's Chris Snow clearly feels that both are true. Depending on your angle, the numbers back up both opinions.
Shot Quality and the Minnesota Wild
I've written about this topic from various angles, here and here.
Shot Quality and the Minnesota Wild
I've written about this topic from various angles, here and here.
Labels: Puck Prospectus, Shooting
Tuesday, August 18, 2009
MLB Signing Bonuses
I haven't found much reason to write about major league baseball recently, but this piece by Jayson Stark about the MLB draft really irks me:
Draft in desperate need of repair
Stephen Strasburg just signed for $15 million - not $50 million - and yet Stark quotes an AL exec: "That's still a gigantic amount of money. Don't kid yourself."
Except it's not. Not in baseball. Carl Pavano pitched 26 games over four seasons and made $38 million. Carlos Silva's in the second year of a 5-year, $60 million contract. His ERAs since he signed: 6.46 and 8.48. That puts the price of a pitcher who has proven himself incapable of getting hitters out or staying healthy at the major-league level is $10-$12 million per season. The Washington Nationals will control Stephen Strasburg for three major-league seasons for barely $16 million, a vast discount over his real value. Top picks bring great value - Justin Upton has cost the Arizona Diamondbacks just over $7 million, but his production will be worth $20 million by season's end.
And Stark wants you to know that he's not just shilling for management: "It's because players want it...big league players want those $15 million deals going to them, not to kids who have never played a professional baseball game."
Of course veteran players want more money - they got robbed of their signing bonuses and were paid at a discount for their first 3-6 seasons. Now they want as big a piece of the pie as possible. But that's not a good reason for Stark to want to squeeze amateur players. Would Stark want anybody to take a 50% or 75% discount in any other career? I think not.
Friday, August 7, 2009
New Puck Prospectus Post: The Dangers of Defensive Zone Faceoffs
"What are the risks of losing a faceoff in the defensive zone in comparison to the neutral zone, and does a coach`s usage of players in faceoffs affect player performance?"
http://www.puckprospectus.com/article.php?articleid=239
http://www.puckprospectus.com/article.php?articleid=239
Labels: Faceoffs, Puck Prospectus
Thursday, August 6, 2009
Derrière le filet: Avec or Sans Saku
"Après quinze ans à Montréal, l'ère Saku Koivu est officiellement terminée. Soit démonisé ou sanctifié, selon le jour de la semaine, il faisait partie des Canadiens toute ma vie d'adulte et a joué 792 parties pour eux, dix-neuvième pour tout les temps. Alors, quelle a été sa valeur à l'équipe?"
http://www.puckprospectus.com/article.php?articleid=238
http://www.puckprospectus.com/article.php?articleid=238
Labels: Puck Prospectus
Sunday, August 2, 2009
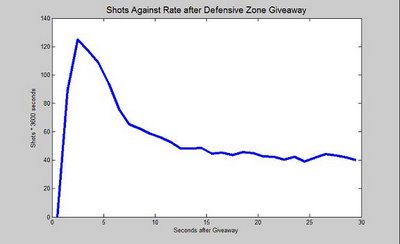
Giveaways
Not surprisingly, giveaways have a highly-negative defensive impact. The peak shot rate against following a giveaway is as high as during a 5-on-3:
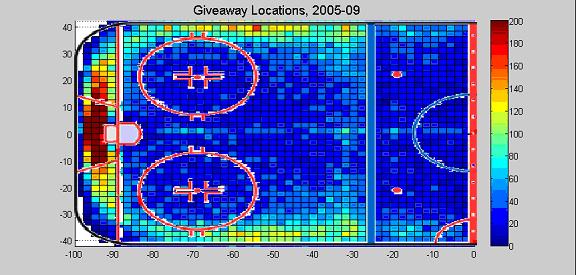
Of course, not all defensive zone giveaways are the same. As you can see from the chart, the vast majority of giveaways occur behind the net and along the boards. It’s not clear whether scorers consistently record the location where the puckhandler gave the puck away, or where the opposing team picked up the turnover. However, since most turnovers occurred behind the goal, it is unlikely that we are substantially undercounting giveaways in the slot, for example, so the chart likely captures the actual distribution of giveaway locations.

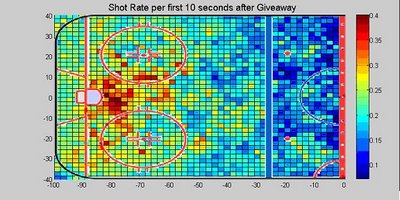
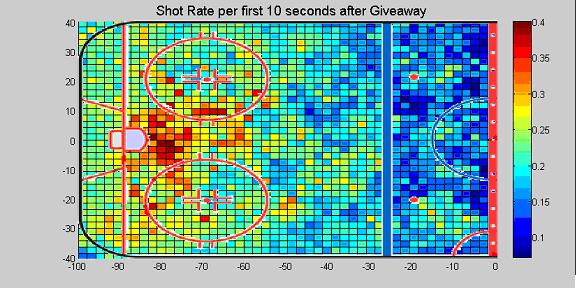
The defensive cost of a giveaway has a slightly different profile. While giveaways behind the net or along the boards result in a shot against over the next 10 seconds of play about 25% of the time, giveaways in front of the goal are (not surprisingly) almost twice as likely to result in a shot.

Of course, not all defensive zone giveaways are the same. As you can see from the chart, the vast majority of giveaways occur behind the net and along the boards. It’s not clear whether scorers consistently record the location where the puckhandler gave the puck away, or where the opposing team picked up the turnover. However, since most turnovers occurred behind the goal, it is unlikely that we are substantially undercounting giveaways in the slot, for example, so the chart likely captures the actual distribution of giveaway locations.
The defensive cost of a giveaway has a slightly different profile. While giveaways behind the net or along the boards result in a shot against over the next 10 seconds of play about 25% of the time, giveaways in front of the goal are (not surprisingly) almost twice as likely to result in a shot.
Labels: Giveaways
Saturday, August 1, 2009
Defenseman's Impact (cont'd...)
I was initially only going to look at the performance of replacement level defensemen to see if their inclusion in the lineup had any additional negative impact relative to that of losing a #1 or #2 defenseman. But I ended up pulling the "With or Without You" data for every defenseman over the last four seasons who played between 10 and 70 games in a season. That ended up being 502 in all.
I looked at two quantities: Even-Strength Save Percentage For and Even-Strength Save Percentage Against, both when the player was in the lineup and when he was out. I then regressed against average TOI. What we get is essentially this, with the coefficients varying slightly depending on how I weight the data:
Opponent's Save Percentage Delta vs Avg TOI = -0.44 * (TOI - 15)
Own Team's Save Percentage Delta vs Avg TOI = +0.44 * (TOI - 15)
TOI isn't a perfect proxy for a defenseman's ability (or for a team's performance when he's in the lineup), so we end up with R^2 in the range of 0.3 to 0.5. Nonetheless, replacing a good defenseman with a bad one tends to decrease your team's shooting percentage and increase your opponent's.
Labels: Replacement Level, Shooting
![]()
Subscribe to Posts [Atom]
