Wednesday, July 29, 2009
Defenseman's impact on Offense
I might as well re-run the previous post on the offensive end of the ice:
Again, the "Better +/-" group had a significant impact on scoring when they were in the lineup: +14.5 goals per 82 games. The "Worse" group generated more shots on goal, but scored less often, resulting in no increase in scoring.
As a whole, here are the offensive and defensive contributions in and out of the lineup:
So we get what we expect when the players are in the lineup: the expected record of a large number of teams is .500. When a top D-man is out of the lineup, both offensive and defensive shot volume and quality suffer to varying degrees, resulting in a .450 team in the aggregate. The difference between these two teams is approximately 8.66 points in the standings, or a little more than four wins. This seems like a reasonable estimate of the value of the average #1 or #2 defenseman.
If we look purely at the change in goals allowed due to not having one good defenseman in particular in the lineup, it accounts for approximately six goals per season. The difference in expected save percentage between the best and worst defensive teams using a simple shot quality model (see: http://www.behindthenet.ca/2008/5_on_5_goalie_shot_quality.php?sort=7&mingp=20) translates to approximately 20-25 goals per 82 games. If we assume that having neither a #1 or #2 defenseman on your team costs you twelve goals on shooting percentage alone, it seems unlikely that much more than half of this 20-25 goal difference is due to a weak defensive corps.
                       IN                        OUT
                  GP   G/GP  S+G/GP  SVPCT  GP   G/GP  S+G/GP  SVPCT  DELTA
N=28 Better +/-   1610 1.89  21.77   913.3  686  1.71  21.16   919.1   5.8
N=25 Worse +/-    1229 1.81  21.76   916.9  821  1.81  21.32   914.9   -2.0
Again, the "Better +/-" group had a significant impact on scoring when they were in the lineup: +14.5 goals per 82 games. The "Worse" group generated more shots on goal, but scored less often, resulting in no increase in scoring.
As a whole, here are the offensive and defensive contributions in and out of the lineup:
                       IN                         OUT
                  GP   G/GP  S+G/GP  SVPCT  GP    G/GP  S+G/GP  SVPCT  DELTA
Offense/GF        2839 1.86  21.77   914.9  1507  1.77  21.25   916.8   1.9
Defense/GA        2839 1.86  21.79   914.5  1507  1.95  21.97   911.0   3.5
So we get what we expect when the players are in the lineup: the expected record of a large number of teams is .500. When a top D-man is out of the lineup, both offensive and defensive shot volume and quality suffer to varying degrees, resulting in a .450 team in the aggregate. The difference between these two teams is approximately 8.66 points in the standings, or a little more than four wins. This seems like a reasonable estimate of the value of the average #1 or #2 defenseman.
If we look purely at the change in goals allowed due to not having one good defenseman in particular in the lineup, it accounts for approximately six goals per season. The difference in expected save percentage between the best and worst defensive teams using a simple shot quality model (see: http://www.behindthenet.ca/2008/5_on_5_goalie_shot_quality.php?sort=7&mingp=20) translates to approximately 20-25 goals per 82 games. If we assume that having neither a #1 or #2 defenseman on your team costs you twelve goals on shooting percentage alone, it seems unlikely that much more than half of this 20-25 goal difference is due to a weak defensive corps.
Labels: Replacement Level, Shooting
Do Defensemen influence Save Percentage?
[Note: this methodology is similar to a previous analysis of replacement level: http://www.behindthenet.ca/blog/2008/04/replacement-level-how-many-wins-do.html. It is obvious that teams do worse when their top players are out of the lineup, but it's not clear what suffers.]
In order to answer this question, I made a list of defensemen over the last four seasons who averaged more than 22 minutes per game and played between 20 and 70 games in a given season. 22 minutes of TOI corresponds approximately to the 60th-best defenseman, which means that the group of subjects includes mostly 1st and 2nd defensemen.
I then counted up the number of even-strength goals and shots against when each defenseman was in the lineup and when he was not dressed. I further split the defensemen into those whose +/- was better than the team's overall +/- (on a per minute basis). Presumably the group with the "Better +/-" would have more of an impact on even-strength defensive zone play.
The results:
The assumption here is that during a given season, a player's aggregate group of teammates, including the goalie, will be basically unchanged whether he's in the lineup or not. Similarly, his team's aggregate group of opponents is assumed to be the same whether he's in the lineup or not.
While the defensive difference with the "Worse +/-" defensemen out of the lineup was negligible, the teams of the "Better +/-" defensemen allowed 15.5 fewer goals per 82 games when they were playing. One-quarter of this change was due to reducing the volume of shots allowed, but the rest is due to better save percentage.
In order to answer this question, I made a list of defensemen over the last four seasons who averaged more than 22 minutes per game and played between 20 and 70 games in a given season. 22 minutes of TOI corresponds approximately to the 60th-best defenseman, which means that the group of subjects includes mostly 1st and 2nd defensemen.
I then counted up the number of even-strength goals and shots against when each defenseman was in the lineup and when he was not dressed. I further split the defensemen into those whose +/- was better than the team's overall +/- (on a per minute basis). Presumably the group with the "Better +/-" would have more of an impact on even-strength defensive zone play.
The results:
                       IN                        OUT
                  GP   G/GP  S+G/GP  SVPCT  GP   G/GP  S+G/GP  SVPCT  DELTA
N=28 Better +/-   1610 1.85  21.48   914.0  686  2.04  21.94   907.2   5.8
N=25 Worse +/-    1229 1.89  22.20   915.1  821  1.89  22.00   914.2   0.9
The assumption here is that during a given season, a player's aggregate group of teammates, including the goalie, will be basically unchanged whether he's in the lineup or not. Similarly, his team's aggregate group of opponents is assumed to be the same whether he's in the lineup or not.
While the defensive difference with the "Worse +/-" defensemen out of the lineup was negligible, the teams of the "Better +/-" defensemen allowed 15.5 fewer goals per 82 games when they were playing. One-quarter of this change was due to reducing the volume of shots allowed, but the rest is due to better save percentage.
Labels: Goaltending, Replacement Level
Tuesday, July 28, 2009
New Puck Prospectus post: Pulling the Goalie
"at the end of the game, there is no value to having played it safe and having lost by only one goal. In the last two minutes of regulation time, scoring rates increase dramatically as the team that's down a goal pulls its goaltender for an extra attacker. We can see that the boldest teams pull their goalie with about 90 seconds to go in the game, and at around 40 seconds to go, the goaltender is almost certainly on the bench."
http://www.puckprospectus.com/article.php?articleid=232
http://www.puckprospectus.com/article.php?articleid=232
Labels: Pulling the Goalie
Monday, July 27, 2009
Shooting Percentage Estimation Errors
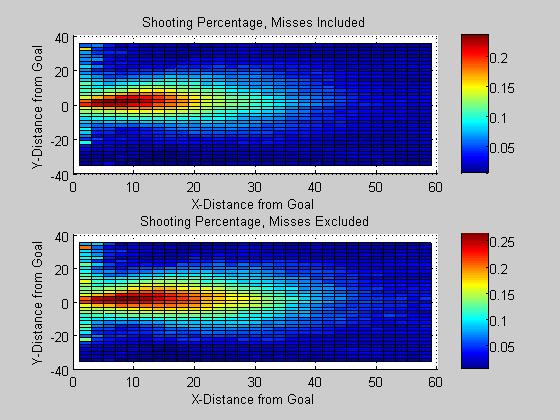
I recently found location data for missed shots going back four years, so I decided to compare shooting percentage estimates with and without missed shots. When missed shots are included, the high shooting percentage in the slot decreases substantially in size:
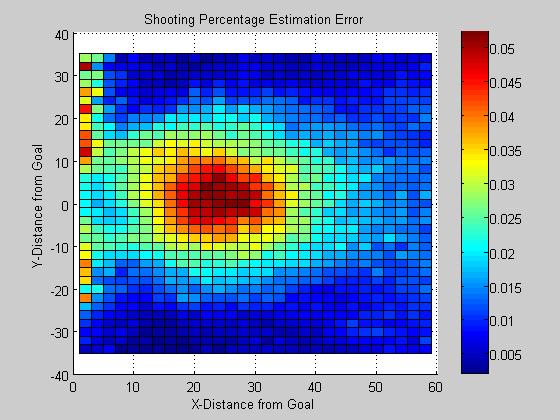
We can see where the estimate error is largest by subtracting the dataset that includes misses from the one that doesn't:

So by failing to include missed shots, we've substantially overestimated the shooting percentage in the high slot, 20 to 30 feet out from the goal. We can also express the error as a percentage:
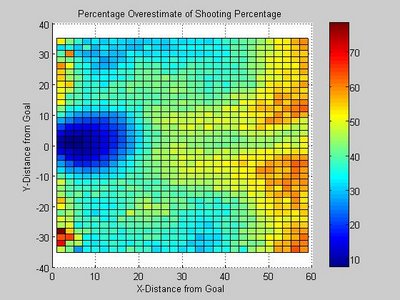
This gives a different result - shots from the blue line are much less likely to go in than we would otherwise think. If we had location data for shots that get blocked (we only know where they were blocked, not where they were shot from), we'd probably find that we're making an even larger overestimate.
We can see where the estimate error is largest by subtracting the dataset that includes misses from the one that doesn't:
So by failing to include missed shots, we've substantially overestimated the shooting percentage in the high slot, 20 to 30 feet out from the goal. We can also express the error as a percentage:

This gives a different result - shots from the blue line are much less likely to go in than we would otherwise think. If we had location data for shots that get blocked (we only know where they were blocked, not where they were shot from), we'd probably find that we're making an even larger overestimate.
Labels: Shooting
Thursday, July 16, 2009
Do Fighters Ever Prosper?
New column on Puck Prospectus:
http://www.puckprospectus.com/article.php?articleid=222
"I looked at every fight during the 2008-09 season where one player received was voted the winner by at least 50% of fans. Since many people vote that a fight was a draw, this picks out only the fights with a clear winner. I then looked at how many goals the winner's team scored and allowed over the next 10 minutes and over the rest of the game. I compared this goal differential with how an average NHL team did given the same initial score and time on the clock. That is, if a team was down 2-1 at the midway point of the 2nd period and won a fight, I compared their performance to all teams that were down 2-1 midway through the second."
Labels: Fights, Puck Prospectus
Tuesday, July 14, 2009
Goaltender Pairs and 5v5 Rebounds
Here are all of the 2008-09 Goaltending pairs where shot totals were roughly even. Draw your own conclusions...
| Name | Team | SH | REB%<2 | REB%<4 | SPCT |
| Jonas Hiller | ANH | 848 | 4.12 | 7.9 | 932 |
| J. Giguere | ANH | 881 | 3.51 | 5.78 | 913 |
| Kari Lehtonen | ATL | 1086 | 3.68 | 6.07 | 923 |
| Johan Hedberg | ATL | 621 | 3.54 | 6.11 | 909 |
| Tim Thomas | BOS | 1266 | 3.55 | 5.92 | 940 |
| Manny Fernandez | BOS | 619 | 4.68 | 6.78 | 927 |
| N. Khabibulin | CHI | 862 | 4.52 | 7.54 | 932 |
| Cristobal Huet | CHI | 760 | 3.94 | 5.92 | 917 |
| Peter Budaj | COL | 1154 | 4.59 | 6.06 | 906 |
| Andrew Raycroft | COL | 650 | 3.38 | 6.61 | 909 |
| Ty Conklin | DET | 779 | 3.97 | 7.7 | 920 |
| Chris Osgood | DET | 894 | 5.25 | 6.48 | 904 |
| Tomas Vokoun | FLA | 1463 | 4.98 | 8.2 | 935 |
| Craig Anderson | FLA | 726 | 4.26 | 6.74 | 928 |
| Jonathan Quick | LA | 875 | 3.08 | 5.71 | 923 |
| Erik Ersberg | LA | 471 | 3.18 | 5.09 | 912 |
| Carey Price | MON | 1115 | 3.76 | 5.91 | 921 |
| Jaroslav Halak | MON | 814 | 3.43 | 6.38 | 923 |
| Scott Clemmensen | NJ | 869 | 3.79 | 5.06 | 927 |
| Martin Brodeur | NJ | 629 | 5.08 | 6.67 | 934 |
| Pekka Rinne | NSH | 1173 | 4.17 | 6.64 | 927 |
| Dan Ellis | NSH | 678 | 4.27 | 6.48 | 918 |
| Yann Danis | NYI | 695 | 3.45 | 5.75 | 922 |
| Joey MacDonald | NYI | 1168 | 4.1 | 5.99 | 906 |
| Alex Auld | OTT | 829 | 4.22 | 6.75 | 920 |
| Brian Elliott | OTT | 601 | 3.49 | 5.65 | 920 |
| Mike Smith | TB | 883 | 3.85 | 5.77 | 929 |
| Karri Ramo | TB | 498 | 3.21 | 7.22 | 913 |
Labels: Goaltending
Goaltender Rebound Percentage Leaders
In his work on Shot Quality, Alan Ryder noted that shooting percentage is extremely high on rebounds. That is, in the two seconds following another shot. The overall save percentages for 2008-09:
After four seconds, shooting percentages are in the low-to-mid 900s. So it is significant to look at what percentage of a goalie's shots are rebounds allowed less than 2, 3 and 4 seconds after a previous shot. Here are the league "leaders":
And at the other end:
| Overall | 1-2 s | 3 s | 4 s |
| 919 | 694 | 807 | 892 |
After four seconds, shooting percentages are in the low-to-mid 900s. So it is significant to look at what percentage of a goalie's shots are rebounds allowed less than 2, 3 and 4 seconds after a previous shot. Here are the league "leaders":
| Goalie | PCT<2s | PCT<3s | PCT<4s |
| EVGENI NABOKOV | 5.52 | 6 | 7.61 |
| MIIKKA KIPRUSOFF | 5.33 | 6.24 | 8.25 |
| CAM WARD | 5.31 | 6.38 | 7.09 |
| CHRIS OSGOOD | 5.25 | 5.59 | 6.48 |
| MATHIEU GARON | 5.19 | 5.73 | 6.55 |
| MICHAEL LEIGHTON | 5.16 | 6.25 | 7.06 |
| MARTIN BRODEUR | 5.08 | 5.72 | 6.67 |
| TOMAS VOKOUN | 4.98 | 6.63 | 8.2 |
| MANNY FERNANDEZ | 4.68 | 5.81 | 6.78 |
| PETER BUDAJ | 4.59 | 5.37 | 6.06 |
And at the other end:
| Goalie | PCT<2s | PCT<3s | PCT<4s |
| CHRIS MASON | 3.25 | 4.42 | 5.96 |
| STEVE MASON | 3.24 | 4.43 | 6.22 |
| KARRI RAMO | 3.21 | 5.22 | 7.22 |
| ERIK ERSBERG | 3.18 | 4.67 | 5.09 |
| JONATHAN QUICK | 3.08 | 3.77 | 5.71 |
| JASON LABARBERA | 3 | 4.6 | 5.61 |
| RYAN MILLER | 2.84 | 3.84 | 5.76 |
| BRENT JOHNSON | 2.69 | 3.92 | 4.9 |
| MARTIN GERBER | 2.6 | 3.9 | 4.72 |
| JOSH HARDING | 1.79 | 3.58 | 5.67 |
Labels: Goaltending
Sunday, July 12, 2009
Variations on a Theme: Different Formulations of Quality of Competition
One very nice innovation on Quality of Competition came from Jonathan Willis at Copper 'n Blue. In order to calculate Quality of Competition, you normally need 1) TOI totals for every player; and 2) head-to-head icetime totals for every player combination. This data is only available for the NHL, and it's only available for the last three years. What Willis did was to use goal events as a proxy for icetime. That is, in the absence of TOI, Willis assumed that the total number of goals a player was on the ice for was a reasonable proxy for the amount of time he spent matched up against specific opposing players.
That changes the Quality of Competition from:
QoC = sum[(Opponent Rating)*(Opponent TOI)]/TOI
Where Rating = (GFON/60 - GAON/60) - (GFOFF/60 - GAOFF/60) for each opponent.
To something like:
QoC = sum[(Opponent Rating#2)*(Opponent + and - per GP)]/(Opponent + and - per GP)
Where Rating#2 = (GFON/GP - GAON/GP) - (GFOFF/GP - GAOFF/GP)
Or something very similar - I don't think it matters very much whether you use GP or total events as a proxy for TOI.
At any rate, I generated Quality of Competition four different ways for the Edmonton Oilers. Rankings among regular players are below:
QC0 is Quality of Competition as calculated on my site. QC1 is the same TOI-based calculation, but it includes only the off-ice stats for games the player played in (for simplicity of calculation, QC0 includes all of a team's games.) QC2 assumes total TOI is known, but uses goal events (+ and -) as a proxy for head-to-head icetime. QC3 is the same as QC2, but uses games played as a proxy for TOI.
Some results are similar: everybody loves Horcoff and Moreau; everybody hates Stortini. But there are some substantial differences between these systems too. The TOI based ones favor Sheldon Souray, Dustin Penner and Tom Gilbert, while the proxy systems like Jason Strudwick, Ladislav Smid and Andrew Cogliano.
So my question is - given that I see maybe one Oilers game per season - which system seems to be closest to the right answer? Is the difference tolerable?
That changes the Quality of Competition from:
QoC = sum[(Opponent Rating)*(Opponent TOI)]/TOI
Where Rating = (GFON/60 - GAON/60) - (GFOFF/60 - GAOFF/60) for each opponent.
To something like:
QoC = sum[(Opponent Rating#2)*(Opponent + and - per GP)]/(Opponent + and - per GP)
Where Rating#2 = (GFON/GP - GAON/GP) - (GFOFF/GP - GAOFF/GP)
Or something very similar - I don't think it matters very much whether you use GP or total events as a proxy for TOI.
At any rate, I generated Quality of Competition four different ways for the Edmonton Oilers. Rankings among regular players are below:
                    QC0 QC1  QC2 QC3
ETHANMOREAU          3   3    5   1
SHELDONSOURAY        2   2   12  12
STEVESTAIOS          9   8    3   5
JASONSTRUDWICK      20  20    8   6
LUBOMIRVISNOVSKY     8  10   17  17
SHAWNHORCOFF         1   1    2   4
ALESHEMSKY           5   7    7  19
ALESKOTALIK         17  17   16   7
DENISGREBESHKOV     11   9   13  14
FERNANDOPISANI       3   6    9  11
MARC-ANTOINEPOULIOT 17  18   15  15
ROBERTNILSSON       11  15    6  10
PATRICKO'SULLIVAN    9  11   11  13
DUSTINPENNER         5   4   10  20
LADISLAVSMID        16  14    4   3
ANDREWCOGLIANO      13  13    1   2
KYLEBRODZIAK        19  19   20   8
ZACHERYSTORTINI     21  21   19  18
TOMGILBERT           5   5   18  16
SAMGAGNER           13  16   14  21
LIAMREDDOX          13  12   21   9
QC0 is Quality of Competition as calculated on my site. QC1 is the same TOI-based calculation, but it includes only the off-ice stats for games the player played in (for simplicity of calculation, QC0 includes all of a team's games.) QC2 assumes total TOI is known, but uses goal events (+ and -) as a proxy for head-to-head icetime. QC3 is the same as QC2, but uses games played as a proxy for TOI.
Some results are similar: everybody loves Horcoff and Moreau; everybody hates Stortini. But there are some substantial differences between these systems too. The TOI based ones favor Sheldon Souray, Dustin Penner and Tom Gilbert, while the proxy systems like Jason Strudwick, Ladislav Smid and Andrew Cogliano.
So my question is - given that I see maybe one Oilers game per season - which system seems to be closest to the right answer? Is the difference tolerable?
Labels: Quality of Competition
Saturday, July 11, 2009
Leveraged Icetime Leaders
I'll introduce the details behind leverage later, but for now I'll just give a short explanation. I'm going to define the leverage of a game state - that is, goal differential and time remaining in the game - as the value in Wins of scoring an additional goal minus the cost in Wins of allowing an additional goal. A simple example:
A game is tied at 19:59 of the third period. If your team scores, it will get two points in the standings = 1 Win. If your team is scored on, it will get no points. So the leverage in this situation is 1 Win, which is the highest possible leverage. Using historical data, we can calculate the leverage for every game state.
The average leverage during 2008-09 was 0.329. The top 25 players in leverage (defined as sum(leverage*shift length)/total toi) are shown below, minimum 600 minutes TOI:
We've already identified many of these players as ones who get tough icetime, either by Quality of Competition metrics or through their percentage of "late-and-close" icetime. But some, like Mike Green, didn't make either of those lists despite being on the ice in a lot of tough situations. Not every method is perfect!
Here's the bottom 25:
Clearly some of these players, including the large number of Toronto and Atlanta players, make this list because their teams were so bad that there weren't any high-leverage situations to play in at all. This method is probably not very useful at the bottom end, but hopefully it gives some insight into who got the toughest minutes on the best teams.
A game is tied at 19:59 of the third period. If your team scores, it will get two points in the standings = 1 Win. If your team is scored on, it will get no points. So the leverage in this situation is 1 Win, which is the highest possible leverage. Using historical data, we can calculate the leverage for every game state.
The average leverage during 2008-09 was 0.329. The top 25 players in leverage (defined as sum(leverage*shift length)/total toi) are shown below, minimum 600 minutes TOI:
Player          Pos     Lev.    %TOI
ANTTIPIHLSTROM  LW      0.3616  12.3
ANDREWFERENCE   D       0.3607  20.3
BRANDONCROMBEEN RW      0.3604  20.9
SAMUELPAHLSSON  C       0.3604  23.8
JEFFWOYWITKA    D       0.3596  24.1
MIKEWEAVER      D       0.3595  20.1
BRADWINCHESTER  RW      0.3587  15.8
BARRETJACKMAN   D       0.3576  38.3
ROBNIEDERMAYER  C       0.3567  24.6
JAYMCCLEMENT    C       0.3563  27.3
MILANMICHALEK   RW      0.3560  28.5
MANNYMALHOTRA   C       0.3551  27.8
TRAVISMOEN      LW      0.3551  25.0
ZDENOCHARA      D       0.3551  41.7
MIKEGREEN       D       0.3537  34.8
JANHEJDA        D       0.3536  36.6
JAYMCKEE        D       0.3529  23.9
TIMGLEASON      D       0.3519  29.0
SCOTTGOMEZ      C       0.3518  31.9
P. J.AXELSSON   C       0.3517  24.6
BLAIRBETTS      C       0.3516  17.0
JERREDSMITHSON  C       0.3512  23.0
DAVIDBACKES     RW      0.3510  29.2
JOELWARD        RW      0.3508  25.4
BRETTFESTERLING D       0.3508  13.5
We've already identified many of these players as ones who get tough icetime, either by Quality of Competition metrics or through their percentage of "late-and-close" icetime. But some, like Mike Green, didn't make either of those lists despite being on the ice in a lot of tough situations. Not every method is perfect!
Here's the bottom 25:
Player          Pos     Lev.    %TOI
THOMASPOCK      D       0.2818  15.2
BORISVALABIK    D       0.2899  15.5
CHRISBUTLER     D       0.2920  15.8
PHILIPPEBOUCHER D       0.2951  16.6
MICHAELRUPP     LW      0.2974  12.8
ZACHBOGOSIAN    D       0.2989  16.9
JEFFFINGER      D       0.2991  27.1
RICHPEVERLEY    C       0.2995  21.2
ANDYGREENE      D       0.3001  16.1
JOHNMITCHELL    C       0.3002  21.1
NATHANOYSTRICK  D       0.3003  16.8
KYLETURRIS      C       0.3008  16.5
DOUGWEIGHT      C       0.3009  19.4
BOBBYHOLIK      C       0.3009  12.8
KEITHYANDLE     D       0.3010  23.0
BRIANROLSTON    C       0.3011  19.5
NICLASHAVELID   D       0.3011  32.4
ARRONASHAM      RW      0.3016  13.6
JORDANLEOPOLD   D       0.3018  31.4
TIMCONNOLLY     C       0.3018  18.3
ILYAKOVALCHUK   RW      0.3019  34.5
DAVIDHALE       D       0.3023  14.7
OLLIJOKINEN     C       0.3023  28.9
NIKOLAIKULEMIN  LW      0.3024  20.3
NIKLASHAGMAN    LW      0.3025  22.2
Clearly some of these players, including the large number of Toronto and Atlanta players, make this list because their teams were so bad that there weren't any high-leverage situations to play in at all. This method is probably not very useful at the bottom end, but hopefully it gives some insight into who got the toughest minutes on the best teams.
Labels: Leverage
Hockeyfights.com Top Ten Fights of 2008-09
As voted by the fans. I still don't know why this list doesn't appear on the front page of Hockeyfights.com, but I will happily provide it periodically as a "public service":
| Rating | Description | Winner | Video |
| 9.2 | Nov 26, 2008 - Carcillo v Dorsett | Draw | Video |
| 8.9 | Oct 14, 2008 - Cote v Godard | Godard | Video |
| 8.8 | Oct 30, 2008 - Boulton v Orr | Orr | Video |
| 8.5 | March 3, 2009 - Downey v Janssen | Draw | Video |
| 8.4 | Jan 10, 2009 - Weller v Boll | Weller | Video |
| 8.3 | Mar 19, 2009 - Staubitz v Tootoo | Staubitz | Video |
| 8.3 | Dec 22, 2008 - Carcillo v Strudwick | Strudwick | Video |
| 8.3 | Nov 22, 2008 - Brashear v Shelley | Brashear | Video |
| 8.1 | Nov 4, 2008 - Murray v Nystrom | Murray | Video |
| 8.0 | Mar 10, 2009 - Brashear v Belak | Belak | Video |
Labels: Fights
Thursday, July 9, 2009
WSJ Article: NHL Teams Hunt for Talent in a Frenzied Bazaar
It's tough to fit into their 250-word limit:
http://online.wsj.com/article/SB10001424052970204261704574276204110346362.html
http://online.wsj.com/article/SB10001424052970204261704574276204110346362.html
KHL->NHL Equivalency with TOI
The value of keeping better statistics has finally moved past the NHL, with the top Finnish, Swedish and Russian leagues tracking and publishing ice time figures for every player. There's very little player movement between the NHL and Finland, but there's enough to generate an NHL Equivalency for the other two leagues that accounts for playing time differences.
Here are the Russian (KHL) and Swedish summaries:
This gives equivalencies of 0.57 for the SEL and 0.54 for the KHL. Adjusting for icetime differences, the NHLEs are 0.78 (SEL) and 0.67 (KHL). The Russian figures are surprisingly low - in the past, the top Russian league was better than the SEL, and approached the caliber of the NHL in some cases.
Here are the Russian (KHL) and Swedish summaries:
     N  TOI OTH TOI NHL % TOI OTH/82 NHL/82 SAME TOI
KHL  23   18.0    14.5   80.8   45     24     30
SEL  15   17.9    14.0   77.8   38     22     28
This gives equivalencies of 0.57 for the SEL and 0.54 for the KHL. Adjusting for icetime differences, the NHLEs are 0.78 (SEL) and 0.67 (KHL). The Russian figures are surprisingly low - in the past, the top Russian league was better than the SEL, and approached the caliber of the NHL in some cases.
Labels: Equivalencies
Tuesday, July 7, 2009
Puck Prospectus: Analyzing The Sharks' Defense
http://www.puckprospectus.com/article.php?articleid=216
"One of the downsides of writing about hockey statistics is not necessarily getting to watch all that much hockey. So I decided to watch video of every even-strength goal the San Jose Sharks gave up during the regular season this year."
"One of the downsides of writing about hockey statistics is not necessarily getting to watch all that much hockey. So I decided to watch video of every even-strength goal the San Jose Sharks gave up during the regular season this year."
Labels: Puck Prospectus
Friday, July 3, 2009
Joe Thornton's giveaways: bad for the Sharks?
Joe Thornton made one particularly egregious giveaway this season. Unfortunately, it was at 14:04 of the 3rd period in Game 4 of the first round of the playoffs, making the score 3-0 Ducks and dashing the Sharks' hopes of evening up the series.
Here's the footage:
http://www.nhl.tv/team/console.jsp?hlg=20082009,3,154&event=ANA623
Ugly...
So I set out to figure out how often Thornton made giveaways like that:
http://www.puckprospectus.com/article.php?articleid=202
"Thornton, though? He spends most of his time skating slowly, fighting for the puck behind the opposing team's net, out-muscling guys along the boards, pushing defensemen out of the way as he carries the puck between them. He's a finesse player, no doubt, but he plays a strength game, and it can at times look almost effortless. Unfortunately, with all that puck possession comes a lot of giveaways. Thornton, because he skates slowly, is never in position to recover his giveaways, which leads to a lot of plays where an opposing player's streaking down the ice, while Thornton is stuck in the offensive zone.
At least it seems that way to many observers, and I've been frequently asked to figure out how many goals Joe Thornton's giveaways cost the Sharks."
Labels: Puck Prospectus
![]()
Subscribe to Posts [Atom]
